. 2018 May 28:9:702.
doi: 10.3389/fpls.2018.00702. eCollection 2018.

The Effect of Single and Multiple SERAT Mutants on Serine and Sulfur Metabolism

Affiliations

The Effect of Single and Multiple SERAT Mutants on Serine and Sulfur Metabolism

Mutsumi Watanabe et al. Front Plant Sci. .

Abstract

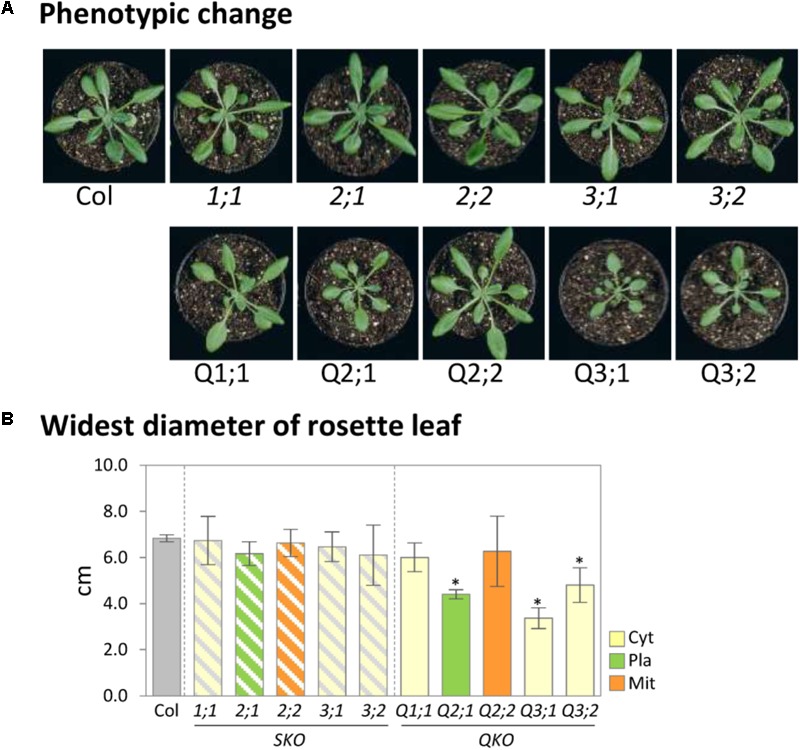
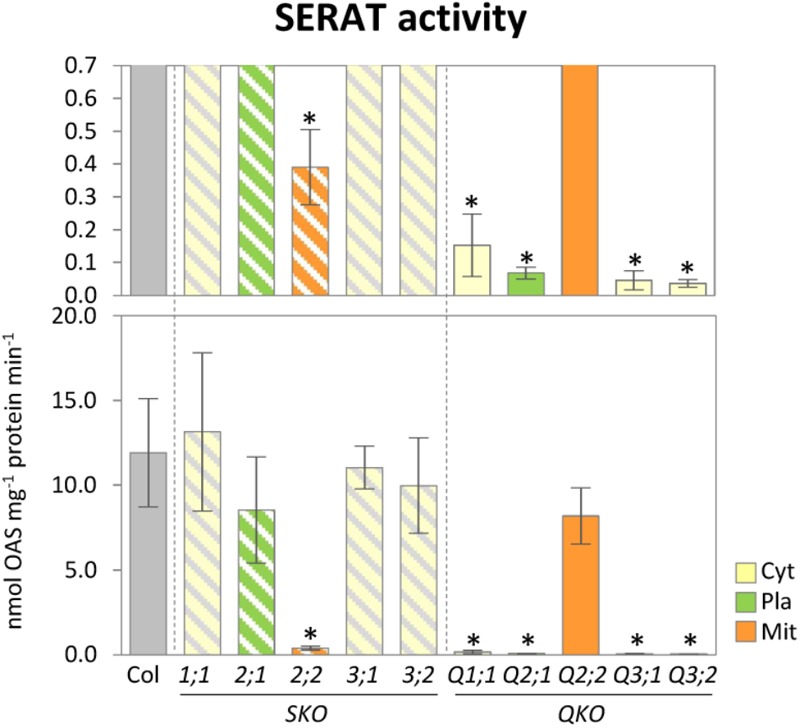
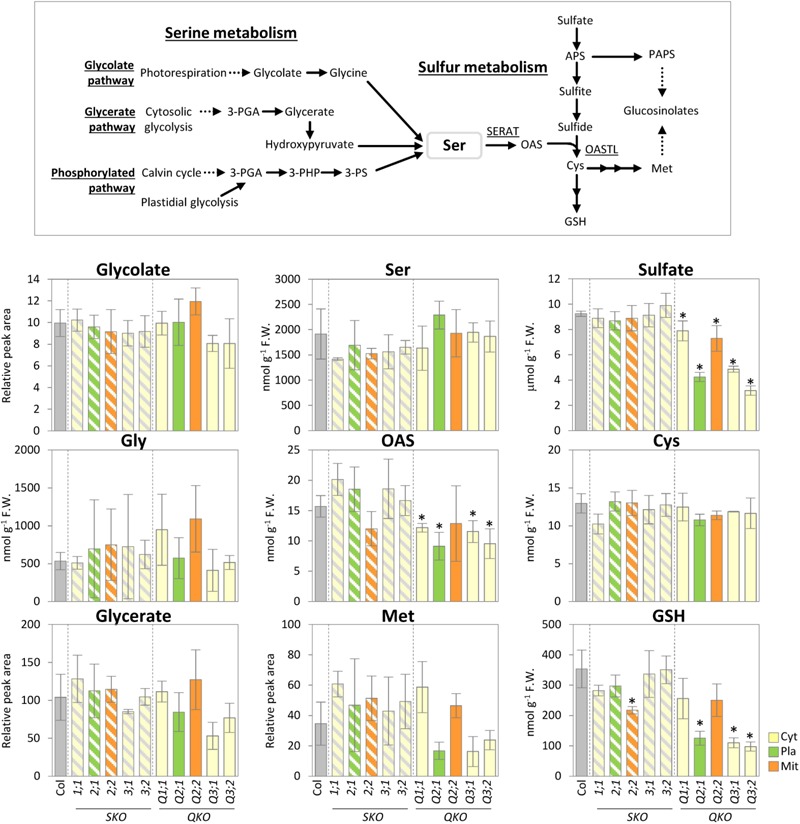
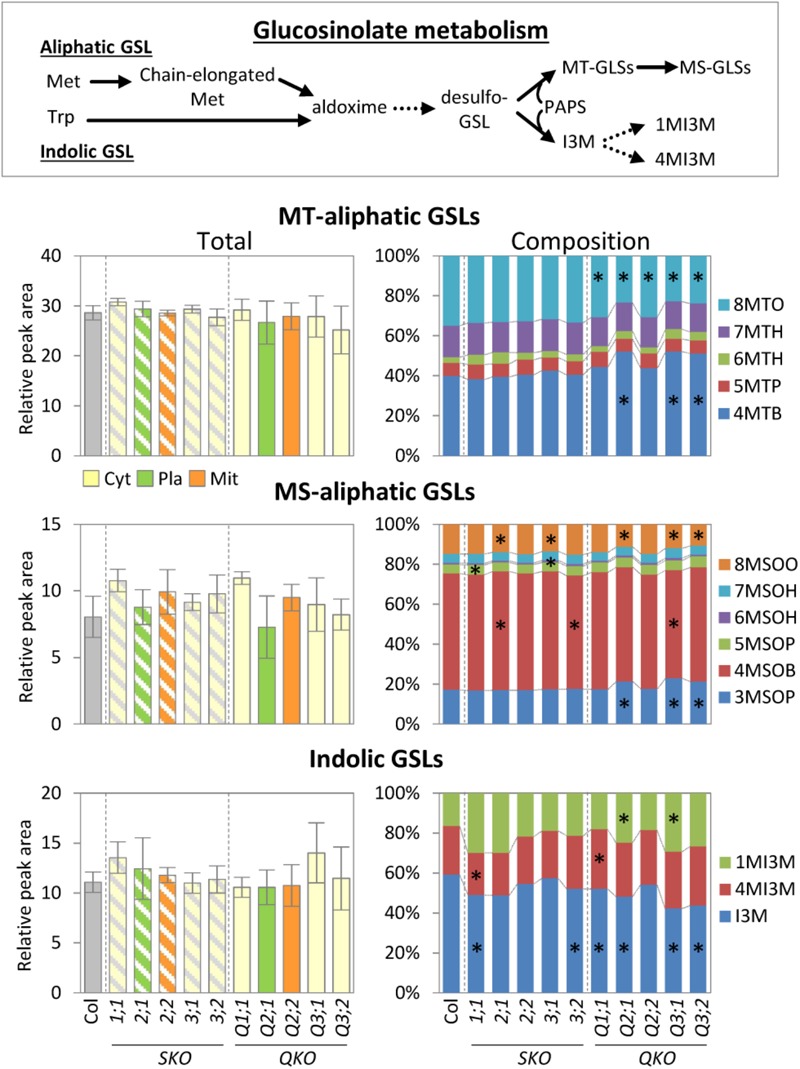
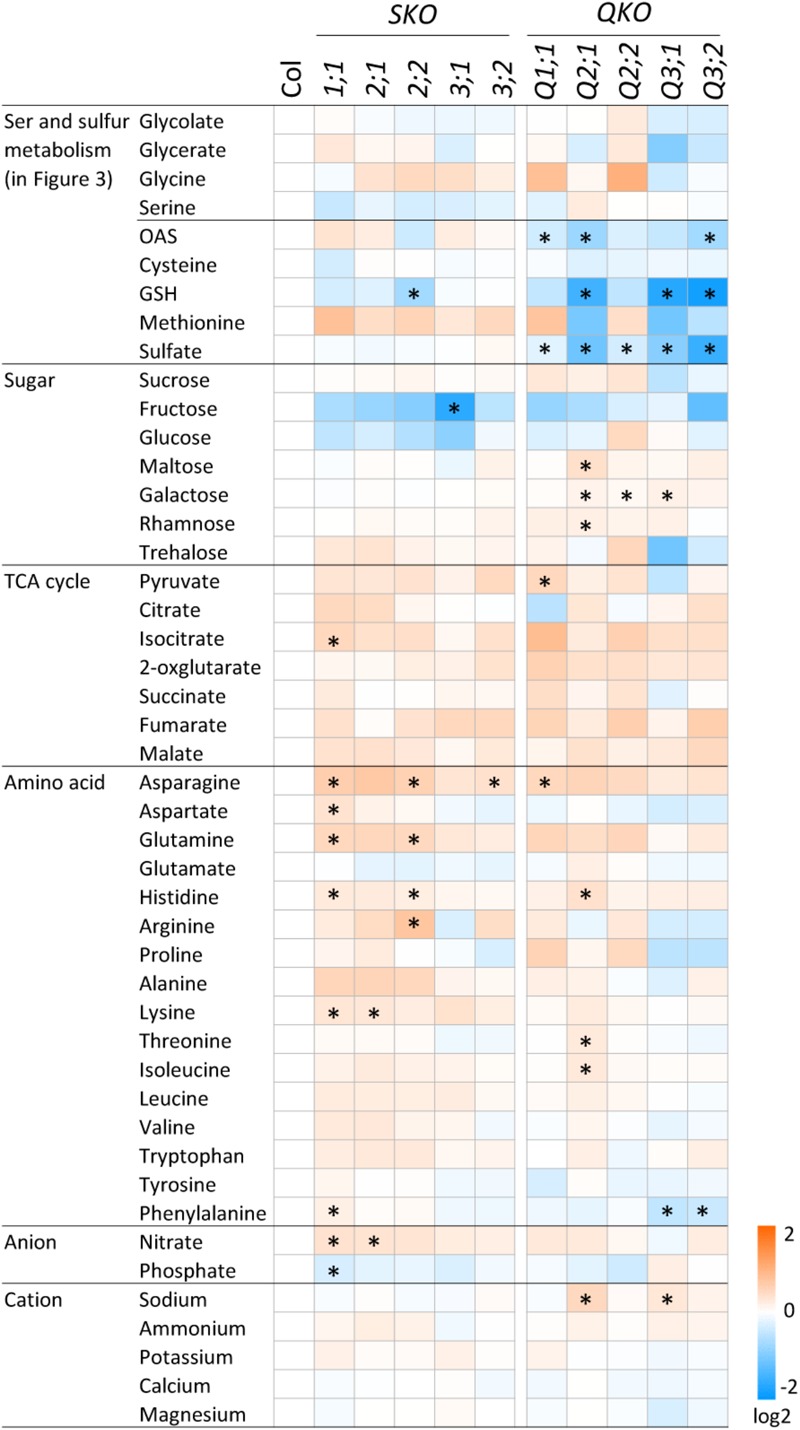
The gene family of serine acetyltransferases (SERATs) constitutes an interface between the plant pathways of serine and sulfur metabolism. SERATs provide the activated precursor, O-acetylserine for the fixation of reduced sulfur into cysteine by exchanging the serine hydroxyl moiety by a sulfhydryl moiety, and subsequently all organic compounds containing reduced sulfur moieties. We investigate here, how manipulation of the SERAT interface results in metabolic alterations upstream or downstream of this boundary and the extent to which the five SERAT isoforms exert an effect on the coupled system, respectively. Serine is synthesized through three distinct pathways while cysteine biosynthesis is distributed over the three compartments cytosol, mitochondria, and plastids. As the respective mutants are viable, all necessary metabolites can obviously cross various membrane systems to compensate what would otherwise constitute a lethal failure in cysteine biosynthesis. Furthermore, given that cysteine serves as precursor for multiple pathways, cysteine biosynthesis is highly regulated at both, the enzyme and the expression level. In this study, metabolite profiles of a mutant series of the SERAT gene family displayed that levels of the downstream metabolites in sulfur metabolism were affected in correlation with the reduction levels of SERAT activities and the growth phenotypes, while levels of the upstream metabolites in serine metabolism were unchanged in the serat mutants compared to wild-type plants. These results suggest that despite of the fact that the two metabolic pathways are directly connected, there seems to be no causal link in metabolic alterations. This might be caused by the difference of their pool sizes or the tight regulation by homeostatic mechanisms that control the metabolite concentration in plant cells. Additionally, growth conditions exerted an influence on metabolic compositions.

Keywords: O-acetylserine; cysteine; serine; serine acetyltransferase; subcellular compartment.


Figures

FIGURE 1
FIGURE 1
Growth phenotypes of serat mutants. (A) Phenotypic changes of serat mutants. Plants were grown for 25 days on soil in plant pots of 6 cm diameter. (B) Widest diameter of rosette leaves of 25-day-old plants. Plants were grown on soil. Data represent the mean (±SD) of three biological replicates. Differences between the wild type and serat mutants were analyzed using Student’s t-test and statistical significance was indicated (P < 0.05). Cyt, cytosol; Pla, plastids; Mit, mitochondria. SKO, serat single mutants (hatched bars); QKO, serat quadruple mutants (color bars).
FIGURE 2
FIGURE 2
Enzymatic activities of SERAT in serat mutants. Enzymatic activities of SERAT. Enzymatic activities were determined using total extracts of soluble proteins prepared from rosette leaves of 25-day-old plants. Data represent the mean (±SD) of three biological replicates. Differences between the wild type and serat mutants were analyzed using Student’s t-test and statistical significance was indicated (P < 0.05). Cyt, cytosol; Pla, plastids; Mit, mitochondria. SKO, serat single mutants (hatched bars); QKO, serat quadruple mutants (color bars).
FIGURE 3
FIGURE 3
Accumulation of serine and sulfur metabolism in serat mutants. Schematic representation of serine and sulfur metabolism and changes of the selected metabolites in rosette leaves of 25-day-old plants. Contents of glycolate, glycerate, and Met were determined by Gas Chromatography/Time of Flight-Mass Spectrometer (GC/TOF-MS) analysis, contents of OAS, Ser and thiols (Cys and GSH) by HPLC analysis and sulfate by ion chromatography. In GC/TOF-MS analysis peak area was normalized to sample fresh weight and the peak area of internal standard. Data represent the mean (±SD) of three biological replicates. Differences between the wild type and serat mutants were analyzed using Student’s t-test and were marked when statistically significant (P < 0.05). Abbreviations: 3-PGA, 3-phosphoglycerate; 3-PHP, 3-phosphohydroxypyruvate; 3-PS, 3-phosphoserine; Ser, serine; OAS, O-acetyl serine; APS, 5′-adenosine phosphosulfate; PAPS, 3′-phosphoadenosine-5′-phosphosulfate; Cys, cysteine; GSH, glutathione; Met, methionine; SERAT, serine acetyltransferase; OASTL, O-acetylserine(thiol)lyase. Cyt, cytosol; Pla, plastids; Mit, mitochondria. SKO, serat single mutants (hatched bars); QKO, serat quadruple mutants (color bars).
FIGURE 4
FIGURE 4
Accumulation of glucosinolate metabolism in serat mutants. Changes of total methylthioalkyl (MT-) aliphatic, methylsulfinylalkyl (MS-) aliphatic, indolic glucosinolate (GSL) contents in rosette leaves of 25-day-old plants. Contents of GSLs were determined by Liquid Chromatography/ElectroSpray Ionization-Mass Spectrometry (LC/ESI-MS) analysis. Peak area was normalized to sample fresh weight and the peak area of an internal standard. Data represent the mean (±SD) of three biological replicates. Percentages in stacked bar plots are displayed as mean percentage between three replicates. Differences between the wild type and serat mutants were analyzed using Student’s t-test and statistical significance was indicated (P < 0.05). Abbreviations: Met, methionine; Trp, tryptophan; PAPS, 3′-phosphoadenosine-5′-phosphosulfate; MT-aliphatic GLSs (4MTB, 5MTP, 6MTH, 7MTH, and 8MSOO, for 4-methylthiobutyl-GSL, 5-methylthiopentyl-GSL, 6-methylthiohexyl-GSL, 7-methylthioheptyl-GSL, and 8-methylthiooctyl-GSL, respectively); MS-aliphatic GLSs (3MSOP, 4MSOB, 5MSOP, 6MSOH, 7MSOH, and 8MSOO, for 3-methylsulfinylpropyl-GSL, 4-methylsulfinylbutyl-GSL, 5-methylsulfinylpentyl-GLS, 6-methylsulfinylhexyl-GLS, 7-methylsulfinylheptyl-GLS, and 8-methylsulfinyloctyl-GLS, respectively); indolic GLSs (I3M, 4MI3M, and 1MI3M, for indolyl-3-methyl-GSL, 4-methoxy-indolyl-3-methyl-GSL, and 1-methoxy-indolyl-3-methyl-GSL). Cyt, cytosol; Pla, plastids; Mit, mitochondria. SKO, serat single mutants (hatched bars); QKO, serat quadruple mutants (color bars).
FIGURE 5
FIGURE 5
Accumulation of primary metabolites in serat mutants. Changes in primary metabolite contents in rosette leaves of 25-day-old plants. Contents of sugars, organic acids in the tricarboxylic acid (TCA) cycle and proline were determined by GC/TOF-MS. Peak area was normalized to sample fresh weight and the peak area of internal standard. Contents of amino acids were determined by HPLC analysis and ions by ion chromatography. Log2 ratios of fold changes from wild-type plant (Col-0) are given by shades of red or blue colors according to the scale bar. Data represent the mean (±SD) of three biological replicates. Differences between the wild type and serat mutants were analyzed using Student’s t-test and statistical significance was indicated (P < 0.05).

Similar articles

Cited by

References

    1. Aarabi F., Kusajima M., Tohge T., Konishi T., Gigolashvili T., Takamune M., et al. (2016). Sulfur deficiency-induced repressor proteins optimize glucosinolate biosynthesis in plants. Sci. Adv. 2:e1601087. 10.1126/sciadv.1601087 - DOI - PMC - PubMed
    1. Andersen T. G., Halkier B. A. (2014). Upon bolting the GTR1 and GTR2 transporters mediate transport of glucosinolates to the inflorescence rather than roots. Plant Signal. Behav. 9:e27740. 10.4161/psb.27740 - DOI - PMC - PubMed
    1. Andersen T. G., Nour-Eldin H. H., Fuller V. L., Olsen C. E., Burow M., Halkier B. A. (2013). Integration of biosynthesis and long-distance transport establish organ-specific glucosinolate profiles in vegetative Arabidopsis. Plant Cell 25 3133–3145. 10.1105/tpc.113.110890 - DOI - PMC - PubMed
    1. Anderson M. E. (1985). Determination of glutathione and glutathione disulfide in biological samples. Methods Enzymol. 113 548–555. 10.1016/S0076-6879(85)13073-9 - DOI - PubMed
    1. Bednarek P., Pislewska-Bednarek M., Svatos A., Schneider B., Doubsky J., Mansurova M., et al. (2009). A glucosinolate metabolism pathway in living plant cells mediates broad-spectrum antifungal defense. Science 323 101–106. 10.1126/science.1163732 - DOI - PubMed