. 2018 May 30;5(5):171559.
doi: 10.1098/rsos.171559. eCollection 2018 May.

Dietary and developmental shifts in butterfly-associated bacterial communities

Affiliations

Dietary and developmental shifts in butterfly-associated bacterial communities

Kruttika Phalnikar et al. R Soc Open Sci. .

Abstract

Bacterial communities associated with insects can substantially influence host ecology, evolution and behaviour. Host diet is a key factor that shapes bacterial communities, but the impact of dietary transitions across insect development is poorly understood. We analysed bacterial communities of 12 butterfly species across different developmental stages, using amplicon sequencing of the 16S rRNA gene. Butterfly larvae typically consume leaves of a single host plant, whereas adults are more generalist nectar feeders. Thus, we expected bacterial communities to vary substantially across butterfly development. Surprisingly, only few species showed significant dietary and developmental transitions in bacterial communities, suggesting weak impacts of dietary transitions across butterfly development. On the other hand, bacterial communities were strongly influenced by butterfly species and family identity, potentially due to dietary and physiological variation across the host phylogeny. Larvae of most butterfly species largely mirrored bacterial community composition of their diets, suggesting passive acquisition rather than active selection. Overall, our results suggest that although butterflies harbour distinct microbiomes across taxonomic groups and dietary guilds, the dramatic dietary shifts that occur during development do not impose strong selection to maintain distinct bacterial communities across all butterfly hosts.

Keywords: diet; insect; metamorphosis; microbiome.


Conflict of interest statement

We declare no competing interests.

Figures
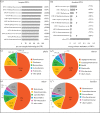
Figure 1.
Figure 1.
The most frequent and most abundant bacterial OTUs associated with butterflies. (a) The most frequent bacterial OTUs observed in more than 80% of butterfly samples. Numbers in parentheses represent the average relative abundance of each OTU. (b) The 10 most abundant bacterial OTUs (with the highest average relative abundance) across butterfly samples. Numbers in parentheses show the proportion of butterfly samples that harboured each abundant OTU. OTUs highlighted by a star are both abundant and frequent OTUs. (c–f) The five most abundant bacterial taxa across all butterfly samples. Each pie chart shows a different taxonomic rank, with each slice representing the percentage of total reads contributed by the taxon. Numbers in parentheses indicate the number of OTUs within each bacterial taxon.
Figure 2.
Figure 2.
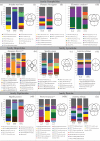
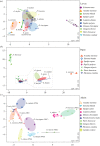
(a) Variation in dominant bacterial communities across butterfly life stages. Stacked bar plots show the average relative abundance of the top 5 dominant bacterial OTUs across all developmental stages of a host. Each panel shows data for a single butterfly species; panels are grouped by family. Venn diagrams in each panel show the number of dominant OTUs that are unique to each developmental stage. Black asterisks next to butterfly species names indicate significant variation in bacterial communities across all developmental stages (permutational multivariate ANOVA–PERMANOVA with 10 000 permutations; p < 0.05). Pink asterisks indicate significant variation in bacterial communities between larvae and adults. (b) Variation in bacterial community across butterfly life stages. Panels show constrained analysis of principal coordinates (CAP) for larvae, pupae and adults of each species based on the composition and relative abundance of bacterial OTUs after applying a 5% abundance cut-off. Axis labels indicate first two linear discriminants (LD1 and LD2) that best explain the classification of samples in different groups (larvae, pupae and adults; see Material and methods). Ellipses represent 95% confidence intervals. Red asterisks denote significant variation across larvae and adults, and black asterisks denote significant variation in bacterial communities across larvae, pupae and adults (electronic supplementary material, table S1D, MANOVA, p < 0.05). For panels (vi–ix), the first linear discriminant explained all of the variation, and is thus represented as a single axis (see electronic supplementary material, table S1D).
Figure 2.
Figure 2.
(a) Variation in dominant bacterial communities across butterfly life stages. Stacked bar plots show the average relative abundance of the top 5 dominant bacterial OTUs across all developmental stages of a host. Each panel shows data for a single butterfly species; panels are grouped by family. Venn diagrams in each panel show the number of dominant OTUs that are unique to each developmental stage. Black asterisks next to butterfly species names indicate significant variation in bacterial communities across all developmental stages (permutational multivariate ANOVA–PERMANOVA with 10 000 permutations; p < 0.05). Pink asterisks indicate significant variation in bacterial communities between larvae and adults. (b) Variation in bacterial community across butterfly life stages. Panels show constrained analysis of principal coordinates (CAP) for larvae, pupae and adults of each species based on the composition and relative abundance of bacterial OTUs after applying a 5% abundance cut-off. Axis labels indicate first two linear discriminants (LD1 and LD2) that best explain the classification of samples in different groups (larvae, pupae and adults; see Material and methods). Ellipses represent 95% confidence intervals. Red asterisks denote significant variation across larvae and adults, and black asterisks denote significant variation in bacterial communities across larvae, pupae and adults (electronic supplementary material, table S1D, MANOVA, p < 0.05). For panels (vi–ix), the first linear discriminant explained all of the variation, and is thus represented as a single axis (see electronic supplementary material, table S1D).
Figure 3.
Figure 3.
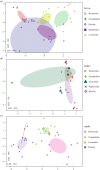
Variation in bacterial communities of developmental stages of different butterfly host species. Panels show constrained analysis of principal coordinates (CAP) for larvae (a), pupae (b) and adults (c) based on the composition and relative abundance of bacterial OTUs after applying a 5% abundance cut-off. Axis labels indicate the proportion of between-group variance (%) explained by the first two linear discriminants (LD1 and LD2). Ellipses represent 95% confidence intervals. For each panel, we observe a significant effect of host species (p < 0.05, multivariate ANOVA). Carnivorous S. epeus larvae (a) and the adult dietary resource (table 1) of each butterfly species are marked (c). In panel (b), the plot area marked with a square is expanded to clearly show ellipses. In panel (a), the impact of host species remained significant even after removing the potential outlier E. torus larvae (electronic supplementary material, figure S12; MANOVA, p < 0.05).
Figure 4.
Figure 4.
Variation in bacterial communities across butterfly host families: (a) larvae, (b) pupae and (c) adults. Panels show constrained analysis of principal coordinates (CAP) for OTUs from larvae, pupae and adults after applying a 5% abundance cut-off. We pooled all individuals belonging to a butterfly taxonomic family, regardless of their species. Axis labels indicate the proportion of between-group variance (%) explained by the first two linear discriminants (LD1 and LD2). Ellipses represent 95% confidence intervals. For each panel, we observe a significant effect of host family (p < 0.05, multivariate ANOVA).
Figure 5.
Figure 5.
Variation in bacterial community composition across butterfly dietary resources. (a) Stacked bar plots show the average relative abundance of the top 5 dominant bacterial OTUs across all larval dietary resources. (b) Variation in bacterial communities of adults with different dietary habits (table 1). Panel shows constrained analysis of principal coordinates (CAP) of OTUs for adults from different dietary guilds after applying a 5% abundance cut-off. Axis labels indicate the proportion of between-group variance (%) explained by the first two linear discriminants (LD1 and LD2). Ellipses represent 95% confidence intervals. We observe a significant effect of dietary resources on adult bacterial communities (p < 0.05, multivariate ANOVA).
Figure 6.
Figure 6.
(af) Bacterial community composition of larvae and their diets. Stacked bar plots represent the average relative abundance of the five most abundant bacterial OTUs. Each bar represents a larval stage or a dietary resource; n = number of replicates sampled. Each panel shows data for a different butterfly species. Variation in bacterial community composition was tested using permutational multivariate ANOVA (PERMANOVA, 1000 permutations). For G. thyrsis, p < 0.05; for all other comparisons, p > 0.05. Pie charts in each panel represent the proportion (%) of dietary bacteria (OTUs) found in larvae (black slice) at the 5% relative abundance cut-off.

Similar articles

Cited by

References

    1. McFall-Ngai MJ. 2002. Unseen forces: the influence of bacteria on animal development. Dev. Biol. 242, 1–14. (doi:10.1006/dbio.2001.0522) - DOI - PubMed
    1. Fraune S, Bosch TCG. 2010. Why bacteria matter in animal development and evolution. Bioessays 32, 571–580. (doi:10.1002/bies.200900192) - DOI - PubMed
    1. McFall-Ngai M, et al. 2013. Animals in a bacterial world, a new imperative for the life sciences. Proc. Natl Acad. Sci. USA 110, 3229–3236. (doi:10.1073/pnas.1218525110) - DOI - PMC - PubMed
    1. Bright M, Bulgheresi S. 2010. A complex journey: transmission of microbial symbionts. Nat. Rev. Micro. 8, 218–230. (doi:10.1038/nrmicro2262) - DOI - PMC - PubMed
    1. Dillon RJ, Dillon VM. 2004. The gut bacteria of insects: nonpathogenic interactions. Annu. Rev. Entomol. 49, 71–92. (doi:10.1146/annurev.ento.49.061802.123416) - DOI - PubMed