. 2018 Jun 7;7(3):17.
doi: 10.1167/tvst.7.3.17. eCollection 2018 May.

A Method Using Goldmann Stimulus Sizes I to V-Measured Sensitivities to Predict Lead Time Gained to Visual Field Defect Detection in Early Glaucoma

Affiliations

A Method Using Goldmann Stimulus Sizes I to V-Measured Sensitivities to Predict Lead Time Gained to Visual Field Defect Detection in Early Glaucoma

Jack Phu et al. Transl Vis Sci Technol. .

Abstract

Purpose: To predict the lead time (difference in time taken for a visual field [VF] defect to be detected) obtained when using stimulus sizes within or near the size of the critical area of spatial summation (Ac), and to test these predictions using sensitivity measurements from a cohort of glaucoma patients.

Methods: Thirty-seven patients with early open-angle glaucoma and 60 healthy observers underwent VF testing on the Humphrey Field Analyzer in full threshold mode using Goldmann stimulus sizes I to V (GI-V) across the 30-2 test grid. We used the sensitivities measured using GI to V in healthy patients to predict the lead time gained by using stimulus sizes within the size of Ac at all locations within the 30-2 grid. Then, we used sensitivities measured in the glaucoma patients to test this predictive model.

Results: Median lead time to VF defect detection when using stimulus sizes within Ac compared with stimulus sizes larger than Ac was 4.1 years across the 30-2 test grid (interquartile range, 3.1 and 5.1 years). Sensitivities of the glaucoma patients showed good agreement with the predictive model of lead time gained (77.5%-84.3% were within ±3 dB).

Conclusions: Our model predicted substantial lead time differences when using stimulus sizes within or near Ac. Such stimulus sizes could potentially detect VF defects, on average, 4 years earlier than current paradigms.

Translational relevance: Stimulus sizes within or near Ac may be more suitable for early detection of glaucomatous VF defects. Larger stimulus sizes may be more suitable for later monitoring of established disease.

Keywords: Humphrey Field Analyzer; Ricco's area; contrast sensitivity; perimetry; spatial summation.


Figures

Figure 1
Figure 1
(A) An example of a two-line fit spatial summation function relating the mean sensitivities (log Weber contrast) measured using the five Goldmann stimulus sizes (each datum point: GI–V, log degrees2). Two representative subjects are presented (healthy: black; glaucoma: red) at a single representative location, adapted from previous studies. The point of inflection indicates the estimate of the critical area of spatial summation (Ac), and the second slope represents the tangential slope of partial summation (n2). (B) The same spatial summation function in (A) with shaded regions indicating different relative sensitivity reductions occurring in glaucoma when measured using different stimulus sizes, depending on whether they are within Ac. Green shaded region: stimuli within the Ac of both healthy and glaucoma. Yellow: less sensitivity reduction detected, indicates stimulus sizes larger than the normal Ac but within the Ac of glaucoma. Red: the least amount of measured sensitivity reduction, indicates a stimulus size larger than the Ac of both healthy and glaucoma patients. Note that in both (A) and (B), there is a predominantly rightward (and only slightly upward) shift in the function of the patient with early glaucoma, relative to the results of the healthy subject. The largely lateral shift of the function indicates the fact that sensitivity loss occurring in early glaucoma could be explained by changes in Ac alone (see Redmond et al.).
Figure 2
Figure 2
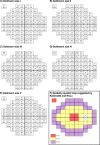
Mean and 95% distribution limits (i.e., the lower 5th percentile) at each test location within the 30-2 test grid (fovea offset to the upper left for clarity, and the two points next to the physiologic blind spot have been crossed out) for Goldmann sizes I to V (A–E). (F) The spatially equated stimulus map as suggested by Kalloniatis and Khuu, in which GI to III are used at various locations in the 30-2 test grid in order to maximize the stimulus size while still being within or near complete spatial summation. The blue border lines indicate the extent of the 24-2 test grid.
Figure 3
Figure 3
Lead time (in years) when using stimulus sizes at or near the size of Ac compared with GIII and GV across all test locations within the 30-2 test grid (the fovea has been offset to the upper left, and the two locations adjacent to the physiologic blind spot have been crossed out). A positive value indicates the number of years earlier that stimulus sizes at or near Ac detect an ‘event' compared with GIII or GV (color coded by binned values of 2 years, with darker values indicating more years of lead time). Note that the white empty cells in the GIII map are test locations at which GIII is near Ac, and hence used within the spatially equated stimulus paradigm. The blue border lines indicate the extent of the 24-2 test grid.
Figure 4
Figure 4
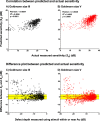
A comparison of sensitivity predicted by the model (SP) and actual measured sensitivities (SA) for Goldmann size III (GIII, black) and Goldmann size V (GV, red) at locations where stimulus size within or near the size of Ac (SES) detected an ‘event'. Top row: the correlation between SP and SA for GIII (A) and GV (B). Pearson's r, R2, and P values shown on each figure. Bottom row: difference plot between SP and SA (in dB) as a function of visual field defect depth (in dB) when measured SES for GIII (C) and GV (D). The dashed black line indicates no difference between SP and SA (y = 0), and the yellow area indicates the region of ±3 dB, which is the approximate test–retest variability of the instrument.
Figure 5
Figure 5
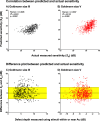
A comparison of sensitivity predicted by the model (SP) and actual measured sensitivities (SA) for Goldmann size III (GIII, black) and Goldmann size V (GV, red) at locations where stimulus size within or near the size of Ac (SES) detected an ‘event' after excluding ‘events', which had reached the measurement floor when using SES (not the difference in x-axis scale compared with Fig. 4). Top row: the correlation between SP and SA for GIII (A) and GV (B). Pearson's r, R2, and P values shown on each figure. Bottom row: difference plot between SP and SA (in dB) as a function of visual field defect depth (in dB) when measured SES for GIII (C) and GV (D). The dashed black line indicates no difference between SP and SA (y = 0), and the yellow area indicates the region of ±3 dB, which is the approximate test–retest variability of the instrument.
Figure 6
Figure 6
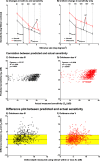
A comparison of spatial summation functions when using a model assuming both a change in sensitivity (a very slight upward shift in the function) and in Ac (predominantly rightward shift) (A) and a model assuming uniform progression rates (i.e., not explained by the change in Ac) across all stimulus sizes (B). A comparison of sensitivity predicted by the model (SP) and actual measured sensitivities (SA) for Goldmann size III (GIII, black) and Goldmann size V (GV, red) at locations where stimulus size within or near the size of Ac (SES) detected an ‘event' after excluding ‘events' that had reached the measurement floor when using SES, as per Figure 5.
Figure 7
Figure 7
Lead time (in years) when using stimulus sizes at or near the size of Ac compared with GIII and GV across all test locations within the 30-2 test grid, plotted as per Figure 3, but for two different progression rates: −0.8 dB/y for the central points (n = 31), and −1.6 dB/y for the two outer concentric “rings” of test locations (n = 44, indicated by the italicized numbers).

Similar articles

Cited by

References

    1. Jampel HD, Singh K, Lin SC, Chen TC, Francis BA, Hodapp E, Samples JR, Smith SD. . Assessment of visual function in glaucoma: a report by the American Academy of Ophthalmology. Ophthalmology. 2011; 118: 986– 1002. - PubMed
    1. Phu J, Khuu SK, Yapp M, Assaad N, Hennessy MP, Kalloniatis M. . The value of visual field testing in the era of advanced imaging: clinical and psychophysical perspectives. Clin Exp Optom. 2017; 100: 313– 332. - PMC - PubMed
    1. Lisboa R, Leite MT, Zangwill LM, Tafreshi A, Weinreb RN, Medeiros FA. . Diagnosing preperimetric glaucoma with spectral domain optical coherence tomography. Ophthalmology. 2012; 119: 2261– 2269. - PMC - PubMed
    1. Medeiros FA, Zangwill LM, Bowd C, Mansouri K, Weinreb RN. . The structure and function relationship in glaucoma: implications for detection of progression and measurement of rates of change. Invest Ophthalmol Vis Sci. 2012; 53: 6939– 6946. - PMC - PubMed
    1. Anderson RS. . The psychophysics of glaucoma: improving the structure/function relationship. Prog Retin Eye Res. 2006; 25: 79– 97. - PubMed