. 2018 May 28:8:162.
doi: 10.3389/fonc.2018.00162. eCollection 2018.

A Testosterone Metabolite 19-Hydroxyandrostenedione Induces Neuroendocrine Trans-Differentiation of Prostate Cancer Cells via an Ectopic Olfactory Receptor

Affiliations

A Testosterone Metabolite 19-Hydroxyandrostenedione Induces Neuroendocrine Trans-Differentiation of Prostate Cancer Cells via an Ectopic Olfactory Receptor

Tatjana Abaffy et al. Front Oncol. .

Abstract

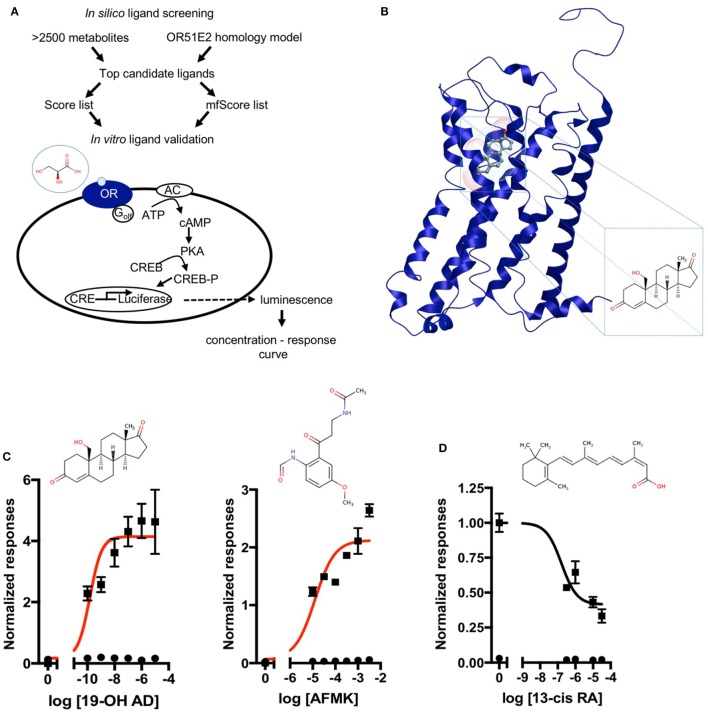
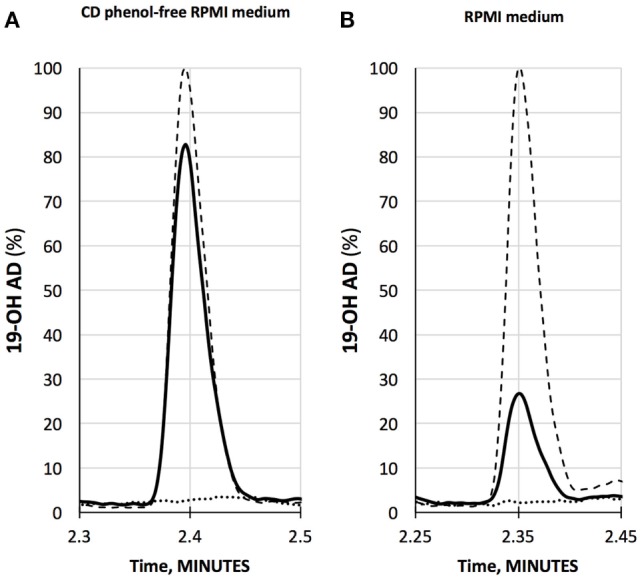
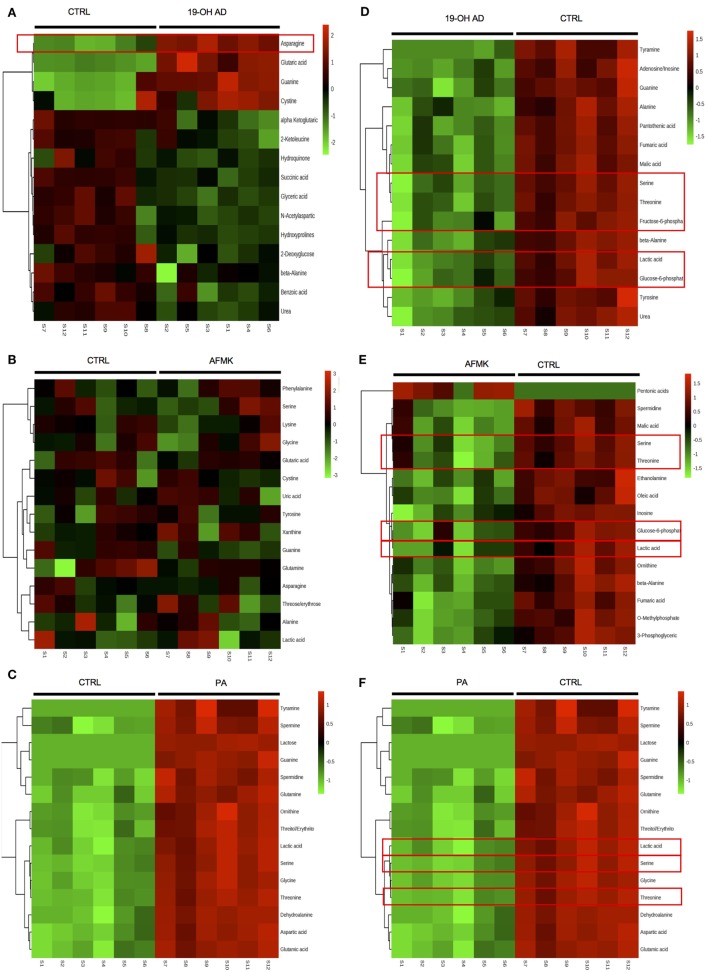
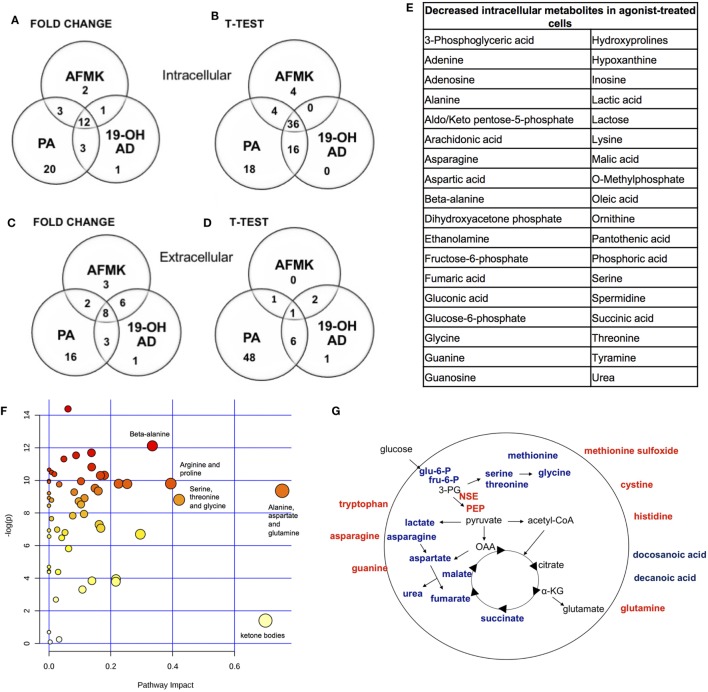
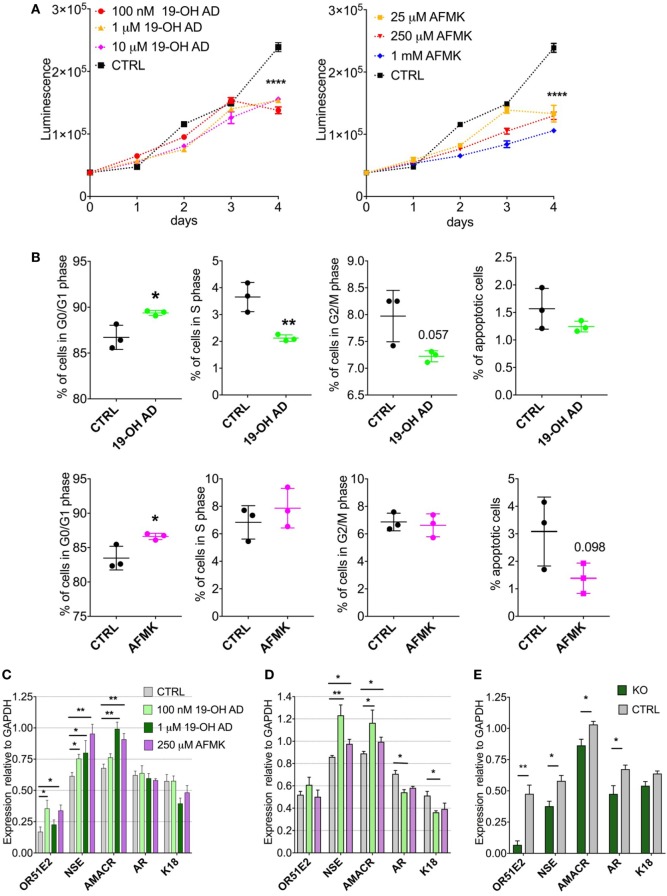
Olfactory receptor OR51E2, also known as a Prostate Specific G-Protein Receptor, is highly expressed in prostate cancer but its function is not well understood. Through in silico and in vitro analyses, we identified 24 agonists and 1 antagonist for this receptor. We detected that agonist 19-hydroxyandrostenedione, a product of the aromatase reaction, is endogenously produced upon receptor activation. We characterized the effects of receptor activation on metabolism using a prostate cancer cell line and demonstrated decreased intracellular anabolic signals and cell viability, induction of cell cycle arrest, and increased expression of neuronal markers. Furthermore, upregulation of neuron-specific enolase by agonist treatment was abolished in OR51E2-KO cells. The results of our study suggest that OR51E2 activation results in neuroendocrine trans-differentiation. These findings reveal a new role for OR51E2 and establish this G-protein coupled receptor as a novel therapeutic target in the treatment of prostate cancer.

Keywords: 19-hydroxyandrostenedione; OR51E2; PSGR; agonists; neuroendocrine trans-differentiation; neuron-specific enolase; olfactory receptor; prostate cancer.


Figures

Figure 1
Figure 1
Discovery of novel endogenous metabolite-ligands for OR51E2. (A) Study design. (B) Homology model of OR51E2 with 19-hydroxyandrost-4-ene-3,17-dione (19-OH AD) docked into the receptor pocket. (C) Concentration–response curves for 19-OH AD and acetyl-N-formyl-5-methoxykynurenamine (AFMK) (red) and their structures. Responses are obtained in the M10d medium and normalized to a no-metabolite control (0 = no metabolite stimulation). (D) Concentration–response curve for antagonist 13-cis retinoic acid (13-cis RA) obtained in the CD293 medium. Response is normalized to a no-metabolite control (1 = no metabolite stimulation) (N = 3, mean ± SEM).
Figure 2
Figure 2
Quantification of 19-OH AD by LC-MS/MS in the medium from AFMK-stimulated LNCaP cells. (A) CD phenol-free RPMI medium with 250 μM acetyl-N-formyl-5-methoxykynurenamine (AFMK) (solid line), 1 ng/mL of 19-OH AD- standard spike (dashed line); estimated concentration of 19-OH AD is 0.83 ng/mL medium. (B) RPMI medium + 250 μM AFMK (solid line), 1 ng/mL 19-OH AD of standard spike (dashed line); estimated concentration of 19-OH AD is 0.27 ng/mL. Dotted lines at the bottom in A and B are media only, with no AFMK. Curves are normalized to 1 ng/mL 19-OH AD.
Figure 3
Figure 3
Agonist treatment of LNCaP cells results in robust metabolomic signatures. The top 15 extracellular metabolites were identified after stimulation with (A) 19-OH AD, (B) acetyl-N-formyl-5-methoxykynurenamine (AFMK), and (C) propionic acid (PA). The top 15 intracellular metabolites were identified after stimulation with (D) 19-OH AD, (E) AFMK, and (F) PA. Heatmaps are based on the Pearson correlation analysis (Ward) and indicate annotated metabolites identified by t-test (P < 0.05, FDR < 0.1, n = 6). Columns correspond to the samples treated with agonists (S1-6) and control (S7-12), and rows correspond to annotated metabolites.
Figure 4
Figure 4
Most pronounced metabolic changes induced by activation of OR51E2 with selected agonists. Venn diagrams show the set of annotated intracellular metabolites differentially expressed by (A) fold change and (B) t-test analysis, and the set of extracellular metabolites identified by (C) fold change and (D) t-test. (E) In total, 36 annotated intracellular metabolites significantly decreased in all three treatments (see Figure 3B). (F) Pathway analysis. The most pronounced pathways in 19-OH AD-treated cells. Pathways are displayed as circles, and the color and size of each circle are based on its P value and pathway impact value, respectively. The top-right area indicates the most significant changes in metabolites. (G) Schematic representation of cellular metabolites. Significantly increased metabolites are in bold red, and significantly decreased are in bold blue (PEP, phosphoenol pyruvate; OAA, oxalacetate; 3PG, 3-phosphoglycerate; α-KG, α-ketoglutarate). Increased neuron-specific enolase (NSE) catalyzes the formation of PEP and is also indicated in red.
Figure 5
Figure 5
Activation of OR51E2 receptor by selected agonists induces a neuroendocrine phenotype. (A) Cell viability assay at various indicated concentrations of 19-OH AD and acetyl-N-formyl-5-methoxykynurenamine (AFMK). Cell viability correlates with luminescence signal. Statistical significance at day 4 with 100 nM 19-OH AD and 250 µM AFMK is ****P < 0.0001. (B) Cell cycle analysis after incubation with 100 nM 19-OH AD and 250 µM AFMK for 7 and 3 days, respectively. (C) Transcript levels of markers after agonist stimulation for 3 days; N = 3–6, unpaired t-test, **P < 0.01. *P < 0.05. (D) Transcript levels of makers after stimulation with agonists for 12 days, N = 3–6, unpaired t-test, **P < 0.01. *P < 0.05. (E) Transcript levels of markers relative to GAPDH after 3 days of stimulation with 1 µM 19-OH AD in OR51E2-KO LNCaP cells. N = 4, mean ± SEM. **P < 0.01. *P < 0.05.

References

    1. Dorsam RT, Gutkind JS. G-protein-coupled receptors and cancer. Nat Rev Cancer (2007) 7(2):79–94.10.1038/nrc2069 - DOI - PubMed
    1. Julius D, Livelli TJ, Jessell TM, Axel R. Ectopic expression of the serotonin 1c receptor and the triggering of malignant transformation. Science (1989) 244(4908):1057–62.10.1126/science.2727693 - DOI - PubMed
    1. Gutkind JS, Novotny EA, Brann MR, Robbins KC. Muscarinic acetylcholine receptor subtypes as agonist-dependent oncogenes. Proc Natl Acad Sci U S A (1991) 88(11):4703–7.10.1073/pnas.88.11.4703 - DOI - PMC - PubMed
    1. Allen LF, Lefkowitz RJ, Caron MG, Cotecchia S. G-protein-coupled receptor genes as protooncogenes: constitutively activating mutation of the alpha 1B-adrenergic receptor enhances mitogenesis and tumorigenicity. Proc Natl Acad Sci U S A (1991) 88(24):11354–8.10.1073/pnas.88.24.11354 - DOI - PMC - PubMed
    1. Gutkind JS. Cell growth control by G protein-coupled receptors: from signal transduction to signal integration. Oncogene (1998) 17(11 Reviews):1331–42.10.1038/sj.onc.1202186 - DOI - PubMed