. 2018 Jul 24;18(15):2187-2201.
doi: 10.1039/c8lc00103k.

NemaFlex: a microfluidics-based technology for standardized measurement of muscular strength of C. elegans

Affiliations

NemaFlex: a microfluidics-based technology for standardized measurement of muscular strength of C. elegans

Mizanur Rahman et al. Lab Chip. .

Abstract

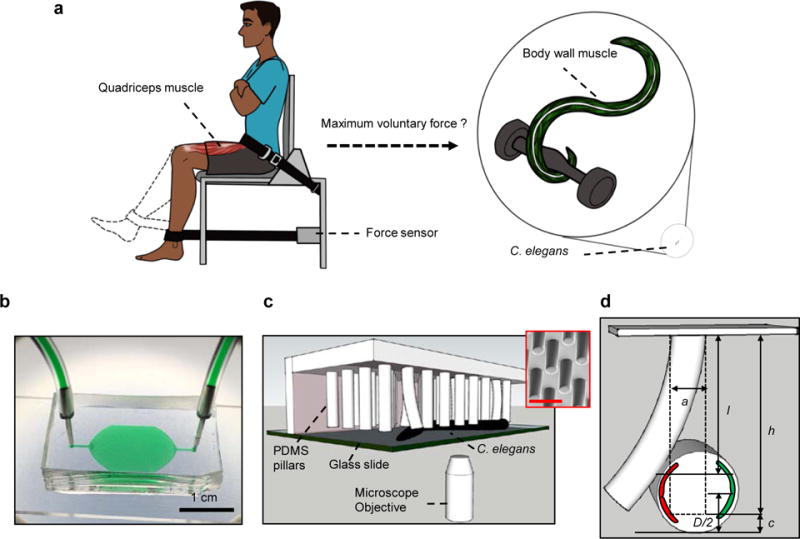
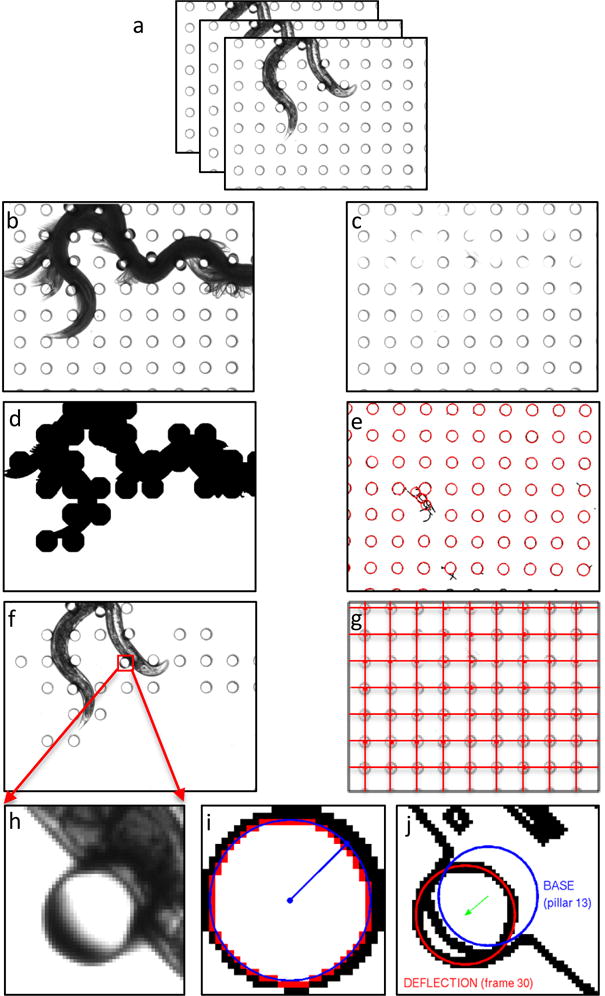
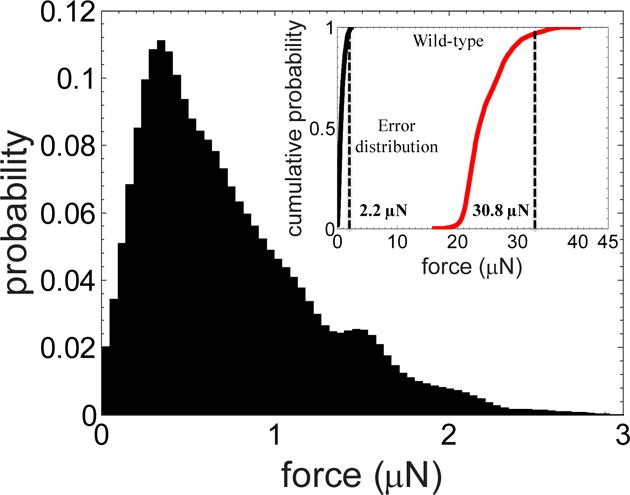
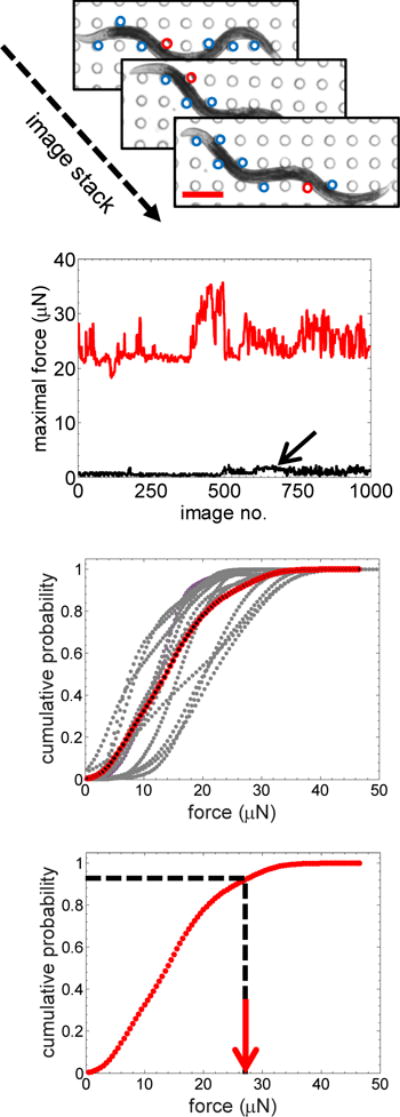
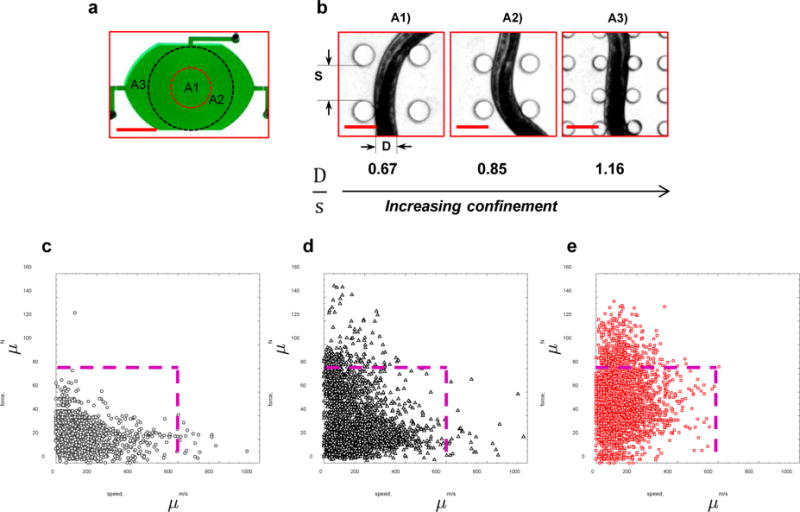
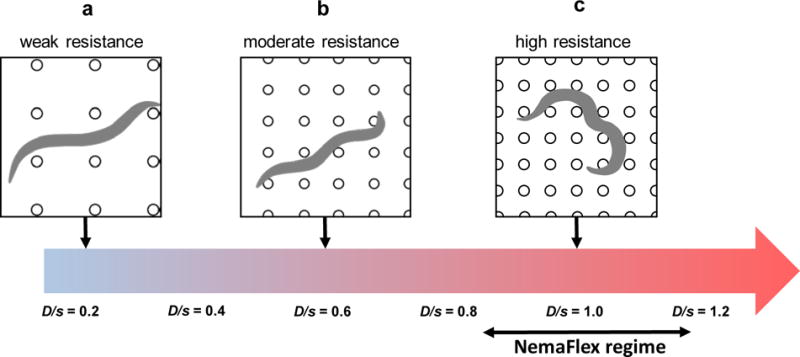
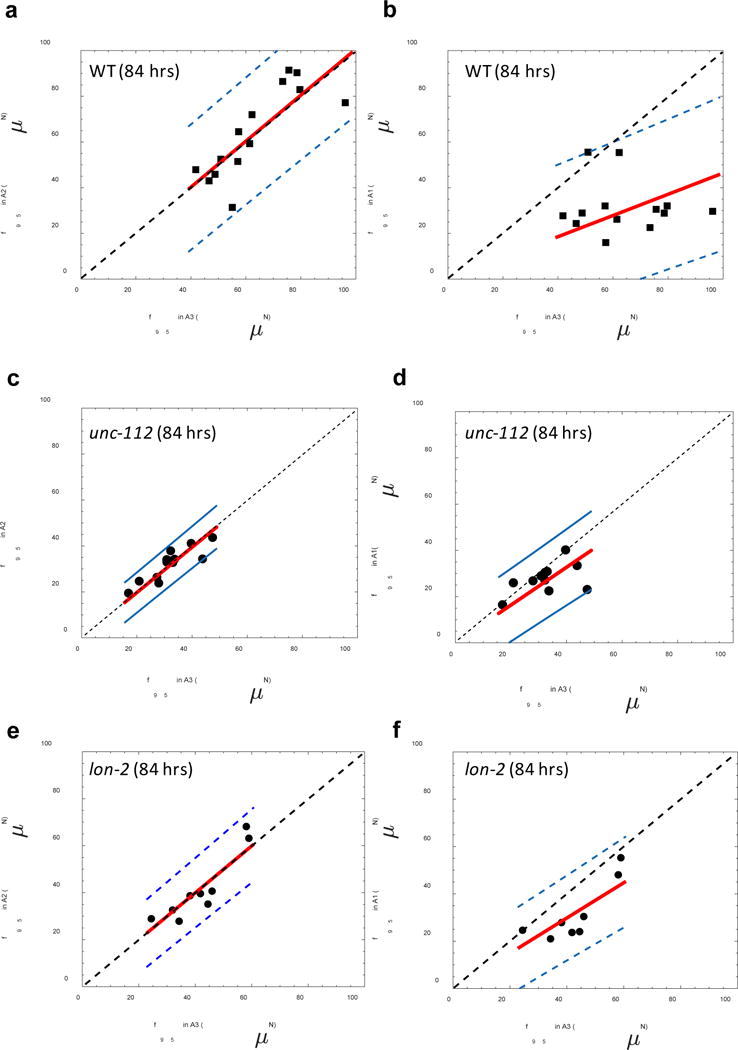
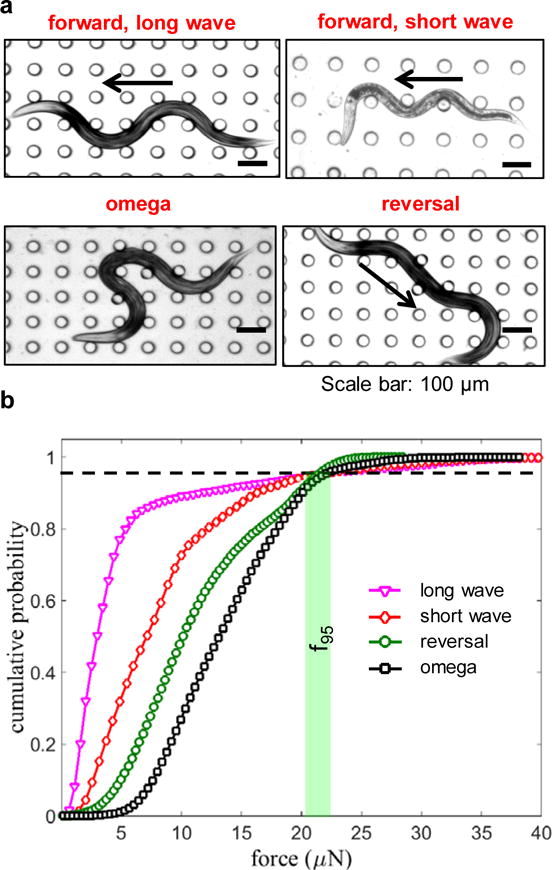
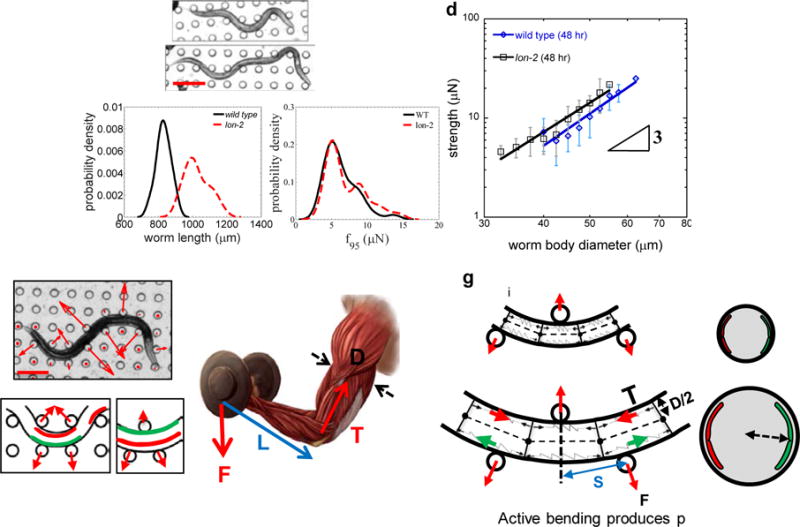
Muscle strength is a functional measure of quality of life in humans. Declines in muscle strength are manifested in diseases as well as during inactivity, aging, and space travel. With conserved muscle biology, the simple genetic model C. elegans is a high throughput platform in which to identify molecular mechanisms causing muscle strength loss and to develop interventions based on diet, exercise, and drugs. In the clinic, standardized strength measures are essential to quantitate changes in patients; however, analogous standards have not been recapitulated in the C. elegans model since force generation fluctuates based on animal behavior and locomotion. Here, we report a microfluidics-based system for strength measurement that we call 'NemaFlex', based on pillar deflection as the nematode crawls through a forest of pillars. We have optimized the micropillar forest design and identified robust measurement conditions that yield a measure of strength that is independent of behavior and gait. Validation studies using a muscle contracting agent and mutants confirm that NemaFlex can reliably score muscular strength in C. elegans. Additionally, we report a scaling factor to account for animal size that is consistent with a biomechanics model and enables comparative strength studies of mutants. Taken together, our findings anchor NemaFlex for applications in genetic and drug screens, for defining molecular and cellular circuits of neuromuscular function, and for dissection of degenerative processes in disuse, aging, and disease.


Conflict of interest statement

Conflicts of interest

There are no conflicts to declare.

Figures

Figure 1
Figure 1. Muscle strength measurement in humans and the NemaFlex system for force measurement in C. elegans
(a) Human muscle function is measured in terms of maximum voluntary force (MVF) during a standardized knee extensor test, where the peak force exerted by the quadriceps muscle is recorded using a force sensor. An equivalent measure of maximum exertable force in C. elegans is currently unavailable. (b) Image of the NemaFlex device filled with green food dye for highlighting the arena and the ports. Scale bar, 1 cm. (c) Schematic showing the C. elegans strength measurement apparatus including the chamber for housing worms, deformable pillar arrays, microscope objective for visualizing pillar deflection, and crawling nematode. Scanning electron microscope (SEM) picture of the pillars (inset). Scale bar, 100 μm. (d) Schematic showing interaction with a pillar by the worm body (exaggerated view). The pillar is deflected due to the action of the body wall muscles (shown in red and green). Parameters defined in Eqn. (1) are shown with actual values being a = 38.3 ± 0.4, h = 71.8 ± 2.9, c = 27.6 ± 2.9 and D = 50 -70 μm (for WT, age = 60 – 84 hrs).
Figure 2
Figure 2. Illustration of the steps in image processing to quantify pillar displacements
(a) Original images of a crawling worm. (b) Foreground image and (c) background image from a stack of images in the preprocessing step. (d) Mask generation from the foreground. (e) Identification of all pillars by applying circular Hough transform. (f) Identification of the candidate pillar for tracking using the mask. (g) Grid verification and validation of pillar location. (h) A candidate pillar selected from a frame (see red arrows) for illustration of deflection measurement. (i) Determination of pillar base location and radius when the worm is not touching the pillar. (j) Measurement of pillar displacement.
Figure 3
Figure 3. Estimation of error in force measurement
False positive force detections in the system were determined by tracking a single undeflected pillar from twenty movies of wild-type worms (age = 60 hrs). The error distribution has a mean at 0.9 μN, a standard deviation of 0.8 μN, and an f95 value of 2.2 μN. Inset compares error distribution relative to the strength of the population. The f95 value of the error distribution is less than 10% of the f95 value for the worm population. There is also zero overlap between the two force distributions, allowing clear distinction between true forces and errors.
Figure 4
Figure 4. Data analysis workflow for NemaFlex strength measurement
(a) Stack of images showing the worm interacting with different pillars during a locomotory episode. The deflected pillars are circled in blue, and the red circle denotes the pillar that experiences the maximum force. Scale bar, 200 μm. (b) Variation of maximal force over time due to a worm interacting with pillars (in red). The black curve shows force variation from the pillars that are not in contact with the worm – giving an estimate of error in our force measurement. (c) Cumulative probability distribution curves of maximal forces for different worms (age = 60 hrs) showing the variability between individuals (n = 14). The red trace represents the cumulative force distribution curve for the population. (d) From the cumulative force distribution curve, the maximum exertable force, f95, is defined as the maximal force at 95% cumulative probability.
Figure 5
Figure 5. Resistance to locomotion determines maximal forces
(a) A composite micropillar arena containing sections A1, A2, and A3 with different pillar spacings to investigate the influence of animal confinement on force generation. Scale bar, 5 mm. (b) The same nematode shown in the three different arenas. The level of confinement (D/s) increases as the worm crawls from arena A1 to A3. Scale bar, 100 μm. The force-velocity data for animals in (c) A1, (d) A2, and (e) A3 arenas. The lines indicate force-velocity cut-offs of 80 μN and 600 μm/s. The data correspond to 17 WT individuals of age 84 hours.
Figure 6
Figure 6. Behavioral phenotyping of C. elegans in pillar arenas with different confinements
The frequency of reversals and turns is higher under tighter confinement due to strong mechanical resistance of the pillar environment. The data correspond to 17 WT individuals of age 84 hours.
Figure 7
Figure 7. Schematic illustrating the effect of animal confinement on mechanical resistance and force generation in pillar environments
The nematode experiences increasing confinement (D/s) from left to right due to increasing density of pillars. (a) Weak resistance, D/s = 0.2, (b) moderate resistance, D/s = 0.6, and (c) strong resistance, D/s = 1.0. Large forces are expected under strong confinement due to enhanced mechanical resistance and constrained body shapes. The operating confinement regime of our NemaFlex system is highlighted.
Figure 8
Figure 8. Highly resistive pillar arenas produce consistent maximum exertable force
A comparison between maximum exertable force f95 measured for WT individuals in (a) section A2 and section A3 (n = 14, slope = 1.01 ± 0.05, r = 0.65) and (b) in section A1 and section A3 (n=13, slope = 0.46 ± 0.07, r = -0.55). A similar comparison is shown for unc-112 animals (n=13 individuals) in (c) A2 and A3 (n = 12, slope 0.99 ± 0.04, r = 0.67) and (d) A1 and A3 (n= 10, slope = 0.81 ± 0.07, r = -0.25). Comparison for lon-2 animals (n=10 individuals) in (e) A2 and A3 (n=9, slope=0.98± 0.05, r = 0.72) and (f) A1 and A3 (n= 8, slope = 0.75 ± 0.07, r = 0.67). The red line is the best-fit curve to the data, and the dashed black line has a slope of unity and passes through origin. The blue lines demarcate the 95% confidence interval region.
Figure 9
Figure 9. NemaFlex quantitates maximum exertable force independent of C. elegans gait
(a) Images showing the different gaits exhibited by crawling WT C. elegans in the pillar arena of the NemaFlex device. The arrows show direction of the animal motion. (b) The cumulative force distribution for the different gaits shown in (a). The horizontal dashed line indicates 95% probability, and the vertical bar highlights that the f95 values for each gait are very similar. Animal age = 60 hrs and D/s = 0.87 – 0.98.
Figure 10
Figure 10. Maximum exertable force is independent of C. elegans behavior in the NemaFlex pillar arena
(a) MEF of WT individuals obtained from analyzing contiguous frames of 30-second duration with a randomly sampled starting point in the movie (movie length is 85 – 120 seconds). Data is shown as mean ± SD from N = 5 sampling trials. 17 individuals showed SD < 10%, while three showed SD between 10 - 16%. (b) MEF values obtained from non-repeating randomly sampled discrete frames. The movie sets are the same as in (a). Data is shown as mean ± SD from N = 5 trials. In this case all 20 individuals showed SD < 10%. (c) MEF of individuals evaluated at three time points: 0, 2, and 2.5 hours. Here a 2-minute episode was captured for each worm and a contiguous 30-second episode was analyzed to obtain MEF. Animal age = 60 hrs and D/s = 0.85 – 0.95.
Figure 11
Figure 11. NemaFlex quantitates maximum muscular strength in C. elegans
(a) A brief protocol for imaging and inducing muscle contraction on individual wild-type C. elegans with 1 mM levamisole. A 60-second episode is captured for each animal before levamisole treatment, and capturing continues for 60 to 200 seconds after the induction. (b) Levamisole treatment-induced muscle contraction causes the body length to decrease by 10.4 ± 3.2%. (age = 60 – 84 hrs, n=51, p < 0.0005). (c) Maximum strength of individual animals before and after the levamisole treatment for three different age groups – 60 hrs (n = 15), 76 hrs (n = 14) and 84 hrs (n = 20). The red line is a linear best fit of the pooled data: slope =1.09 +/− 0.06, intercept = -0.006, and r =0.89. Dashed blue lines show the 95% level confidence interval (n =49). The dashed black line represents f95lev+ = f95lev- (slope of 1 and intercept at origin). A two sample t-test confirms that NemaFlex is measuring the maximum muscular strength of the animal (p =0.24). For this data set, D/s = 0.95 - 1.02. (d) Comparison of population-level force distribution for wild type (n=20, N=3,475 data points) and three C. elegans muscular or neuromuscular mutants unc-52 (n=12, N=14,883 data points), unc-112 (n=5, N=2,992 data points), and unc-17 (n=20, N=6,997 data points). Wilcoxon rank-sum test confirms that NemaFlex is measuring neuromuscular weakness (p > 0.005). For this data set, D/s = 0.85 - 0.92.
Figure 12
Figure 12. Influence of body size on C. elegans muscle strength
(a) Influence of the body length was evaluated by comparing the force production of wild type (top image) and a lon-2 mutant (bottom image). Scale bar, 200 μm. (b) Distribution of the body lengths of wild type (n = 89) and lon-2 (n = 37) at a single time point (48 hours) for similar diameter worms. The lon-2 worms are ≈ 1.3 times longer than wild type. (c) The strength distributions of wild-type and lon-2 worms are statistically similar. Animal populations are the same as in (b). (d) Both wild type (n = 94) and lon-2 (n = 84) show approximately a cubic dependency of strength on body diameter. MEF data for each population was binned using bin widths of 2.5 μm. Data shown is mean ± SD. (e) Active bending of worm body curvature produces pillar forces. The vector sum of the pillar forces (red arrows) is zero in (i). The nematode pushes pillars when trying to (ii) increase or (iii) decrease its curvature. Increase of the curvature is induced by tension from contracting muscles (red in (ii), green shows relaxing muscle). Similarly, decrease of the curvature is initiated by transferring the tension to the other pair of muscles (red in (iii)) by initiating contraction in the relaxed muscle section. Scale bar, 200 μm. (f) Bending moment analysis in the human muscle arm that is lifting a weight. See main text for description of the symbols. (g) A schematic of the worm body segment under active bending where muscles are shown as (i) springs resembling the contraction and relaxation of muscles. T is the muscle tension in the worm, D is the body diameter, F is the pillar force and s is the pillar spacing. (ii) Animals with larger diameters have more muscle cross-sectional area and therefore produce more force.

Similar articles

Cited by

References

    1. Biewener A. Journal of Experimental Biology. 2016;219:285–294. - PMC - PubMed
    1. Frontera W, Ochala J. Calcified Tissue International. 2015;96:183–195. - PubMed
    1. Ansved T. Acta Physiologica Scandinavica. 2001;171:359–366. - PubMed
    1. Lerario A, Bonfiglio S, Sormani M, Tettamanti A, Marktel S, Napolitano S, Previtali S, Scarlato M, Natali-Sora M, Mercuri E, Bresolin N, Mongini T, Comi G, Gatti R, Ciceri F, Cossu G, Torrente Y. Bmc Neurology. 2012;12 - PMC - PubMed
    1. Clark B, Manini T. Journals of Gerontology Series a-Biological Sciences and Medical Sciences. 2008;63:829–834. - PubMed

Publication types