

A continuum of HIV care describing mortality and loss to follow-up: a longitudinal cohort study
- PMID: 29893243
- PMCID: PMC5990495
- DOI: 10.1016/S2352-3018(18)30048-1
A continuum of HIV care describing mortality and loss to follow-up: a longitudinal cohort study
Abstract
Background: The cross-sectional HIV care continuum is widely used to assess the success of HIV care programmes among populations of people with HIV and the potential for ongoing transmission. We aimed to investigate whether a longitudinal continuum, which incorporates loss to follow-up and mortality, might provide further insights about the performance of care programmes.
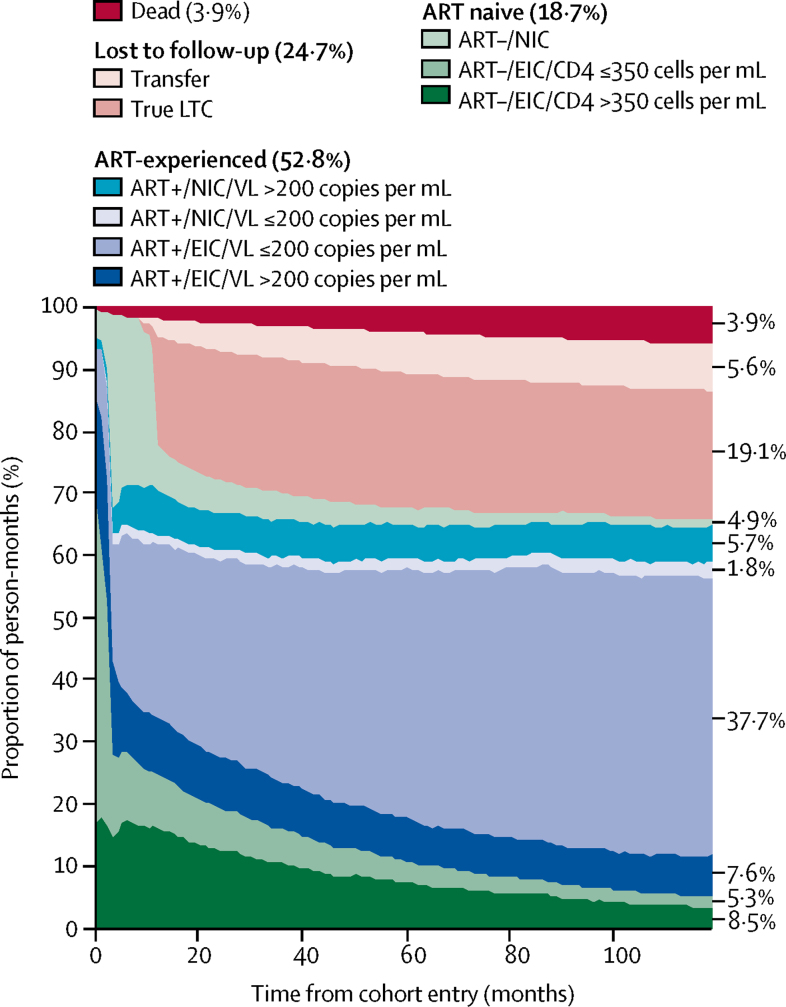
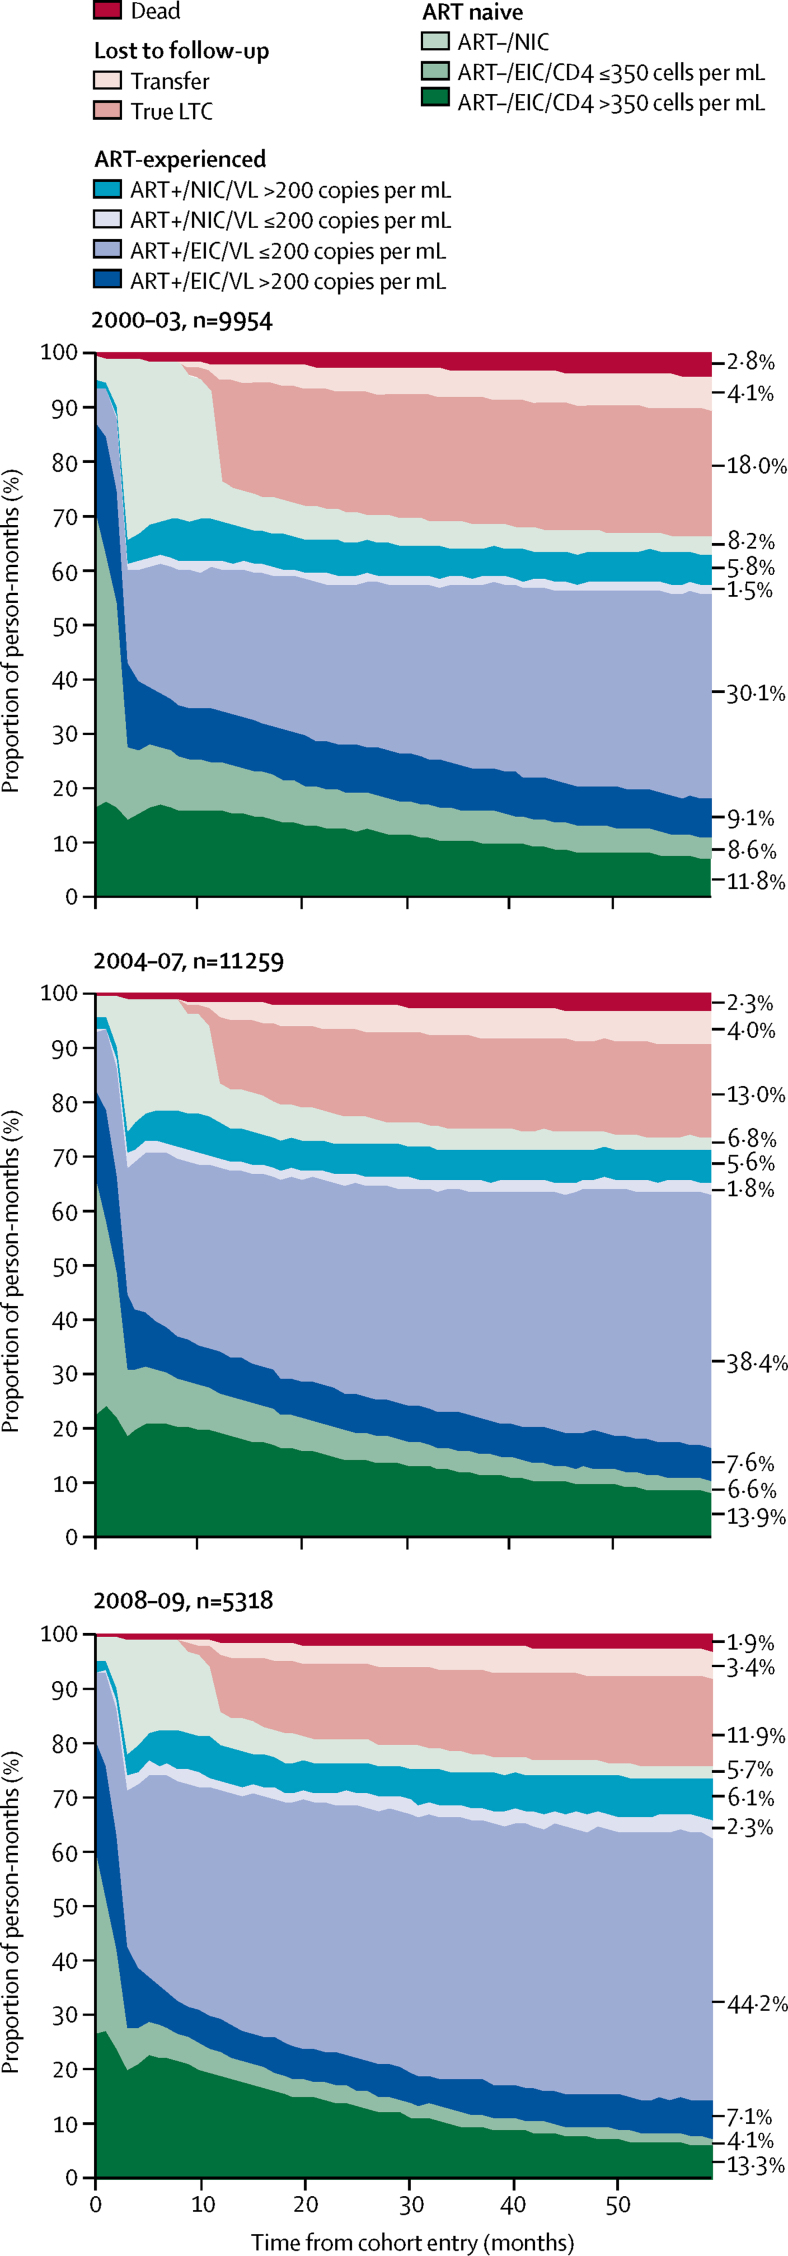
Methods: In this longitudinal cohort study, we included individuals who entered the UK Collaborative HIV Cohort (CHIC) study between Jan 1, 2000, and Dec 31, 2004, and were linked to the national HIV cohort database (HIV and AIDS Reporting System). For each month during a 10 year follow up period, we classified individuals into one of ten distinct categories according to engagement in care, antiretroviral therapy (ART) use, viral suppression, loss to cohort follow-up and loss to care, and mortality, and assessed the proportion of person-months of follow-up spent in each stage of the continuum. 5 year longitudinal continuums were also constructed for three separate cohorts (baseline years of entry 2000-03, 2004-07, and 2008-09) to compare changes over time.
Findings: We included 12 811 people contributing 1 537 320 person-months in our analysis. During 10 years of follow-up, individuals spent 811 057 (52·8%) of 1 537 320 person-months on ART. Of the 811 057 person-months spent on ART, individuals had a viral load of 200 copies per mL or less for 607 185 (74·9%) person-months. 10 years after cohort entry, 3612 (28·1%) of 12 811 individuals were lost to follow-up, 954 (26·4%) of whom had transferred to a non-CHIC UK clinic for care. By 10 years, 759 (5·9%) of 12 811 participants who entered the cohort had died. Loss to follow-up decreased and the proportion of person-months that individuals spent virally suppressed increased over calendar time.
Interpretation: Loss to follow-up in HIV care programmes was high and rates of viral suppression were lower than previously reported. Complementary information provided by a longitudinal continuum might highlight areas for intervention along the HIV care pathway, however, transfers outside the cohort must be accounted for.
Funding: Medical Research Council, UK.
Copyright © 2018 The Author(s). Published by Elsevier Ltd. This is an Open Access article under the CC BY 4.0 license. Published by Elsevier Ltd.. All rights reserved.
Figures
Comment in
-
Understanding the HIV care continuum.Lancet HIV. 2018 Jun;5(6):e269-e270. doi: 10.1016/S2352-3018(18)30102-4. Lancet HIV. 2018. PMID: 29893238 No abstract available.
References
-
- UNAIDS 90-90-90. An ambitious treatment target to help end the AIDS epidemic. 2014. http://www.unaids.org/sites/default/files/media_asset/90-90-90_en.pdf
-
- Skarbinski J, Rosenberg E, Paz-Bailey G. Human immunodeficiency virus transmission at each step of the care continuum in the United States. JAMA Intern Med. 2015;175:588–596. - PubMed
-
- Simmons RD, Ciancio BC, Kall MM, Rice BD, Delpech VC. Ten-year mortality trends among persons diagnosed with HIV infection in England and Wales in the era of antiretroviral therapy: AIDS remains a silent killer. HIV Med. 2013;14:596–604. - PubMed
Publication types
MeSH terms
Substances
Grants and funding
LinkOut - more resources
Full Text Sources
Other Literature Sources
Medical
Research Materials
