

A projection image database to investigate factors affecting image quality in weight-based dosing: application to pediatric renal SPECT
- PMID: 29893291
- PMCID: PMC6105284
- DOI: 10.1088/1361-6560/aacbf0
A projection image database to investigate factors affecting image quality in weight-based dosing: application to pediatric renal SPECT
Abstract
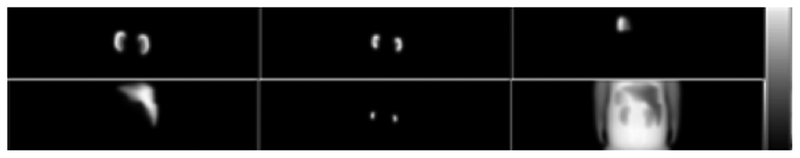
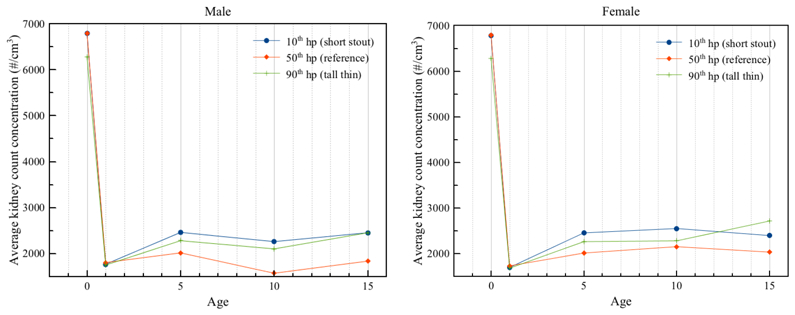
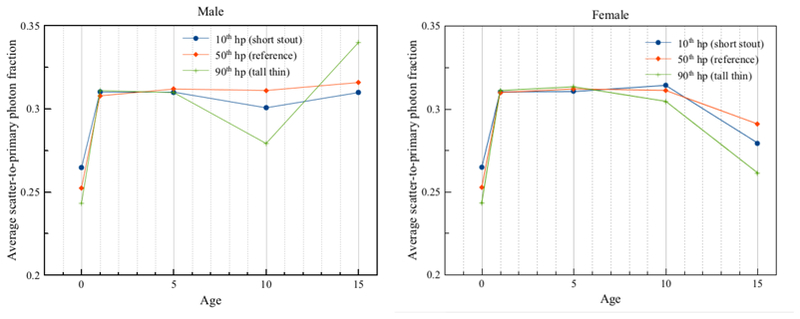
Balancing the tradeoff between radiation dose, acquisition duration and diagnostic image quality is essential for medical imaging modalities involving ionizing radiation. Lower administered activities to the patient can reduce absorbed dose, but can result in reduced diagnostic image quality or require longer acquisition durations. In pediatric nuclear medicine, it is desirable to use the lowest amount of administered radiopharmaceutical activity and the shortest acquisition duration that gives sufficient image quality for clinical diagnosis. However, diagnostic image quality is a complex function of patient factors including body morphometry. In this study, we present a digital population of 90 computational anatomic phantoms that model realistic variations in body morphometry and internal anatomy. These phantoms were used to generate a large database of projection images modeling pediatric SPECT imaging using a 99mTc-DMSA tracer. We used an analytic projection code that models attenuation, spatially varying collimator-detector response, and object-dependent scatter to generate the projections. The projections for each organ were generated separately and can be subsequently scaled by parameters extracted from a pharmacokinetics model to simulate realistic tracer biodistribution, including variations in uptake, inside each relevant organ or tissue structure for a given tracer. Noise-free projection images can be obtained by summing these individual organ projections and scaling by the system sensitivity and acquisition duration. We applied this database in the context of 99mTc-DMSA renal SPECT, the most common nuclear medicine imaging procedure in pediatric patients. Organ uptake fractions based on literature values and patient studies were used. Patient SPECT images were used to verify that the sum of counts in the simulated projection images was clinically realistic. For each phantom, 384 uptake realizations, modeling random variations in the uptakes of organs of interest, were generated, producing 34 560 noise-free projection datasets (384 uptake realizations times 90 phantoms). Noisy images modeling various count levels (corresponding to different products of acquisition duration and administered activity) were generated by appropriately scaling these images and simulating Poisson noise. Acquisition duration was fixed; six count levels were simulated corresponding to projection images acquired using 25%, 50%, 75%, 100%, 125%, and 150% of the original weight-based administrated activity as computed using the North American Guidelines (Gelfand et al 2011 J. Nucl. Med. 52 318-22). Combined, a total number of 207 360 noisy projection images were generated, creating a realistic projection database for use in renal pediatric SPECT imaging research. The phantoms and projection datasets were used to calculate three surrogate indices for factors affecting image quality: renal count density, average radius of rotation, and scatter-to-primary ratio. Differences in these indices were seen across the phantoms for dosing based on current guidelines, and especially for the phantom modeling the newborn. We also performed an image quality study using an anthropomorphic model observer that demonstrates that the weight-based dose scaling does not equalize image quality as measured by the area under the receiver-operating characteristics curve. These studies suggest that a dosing procedure beyond weight-based scaling of administered activities is required to equalize image quality in pediatric renal SPECT.
Conflict of interest statement
Disclosure
The iterative reconstruction software used to generate projections and reconstruct images in this work has been licensed by Johns Hopkins to GE Healthcare. One of the authors, E.C. Frey, receives a portion of the licensing revenue. The terms of this arrangement are being managed by the Johns Hopkins University in accordance with its conflict of interest policies.
Figures


References
-
- Cristy M and Eckerman KF (1987). Specific Absorbed Fractions of Energy at Various Ages for Internal Photon Sources, Oak Ridge National Laboratory; ORNL/TM-8381.
-
- Evans K, Lythgoe MF, Anderson PJ, Smith T and Gordon I (1996). “Biokinetic behavior of technetium-99m-DMSA in children”. J Nucl Med 37(8): 1331–1335. - PubMed
-
- Frey EC, Ju ZW and Tsui BMW (1993). “A Fast Projector-Backprojector Pair Modeling the Asymmetric, Spatially Varying Scatter Response Function for Scatter Compensation in SPECT Imaging” IEEE Transactions on Nuclear Science 40(4): 1192–1197.
Publication types
MeSH terms
Grants and funding
LinkOut - more resources
Full Text Sources
Other Literature Sources
Medical