. 2018 Jul 17;90(14):8396-8403.
doi: 10.1021/acs.analchem.8b00875. Epub 2018 Jun 28.

Autonomous Multimodal Metabolomics Data Integration for Comprehensive Pathway Analysis and Systems Biology

Affiliations

Autonomous Multimodal Metabolomics Data Integration for Comprehensive Pathway Analysis and Systems Biology

Tao Huan et al. Anal Chem. .

Abstract

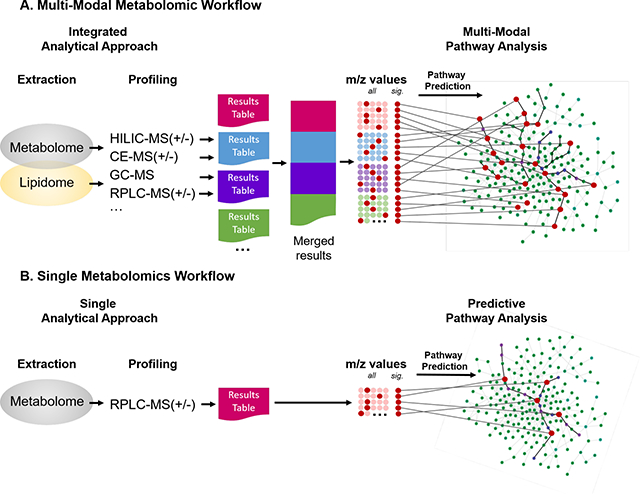
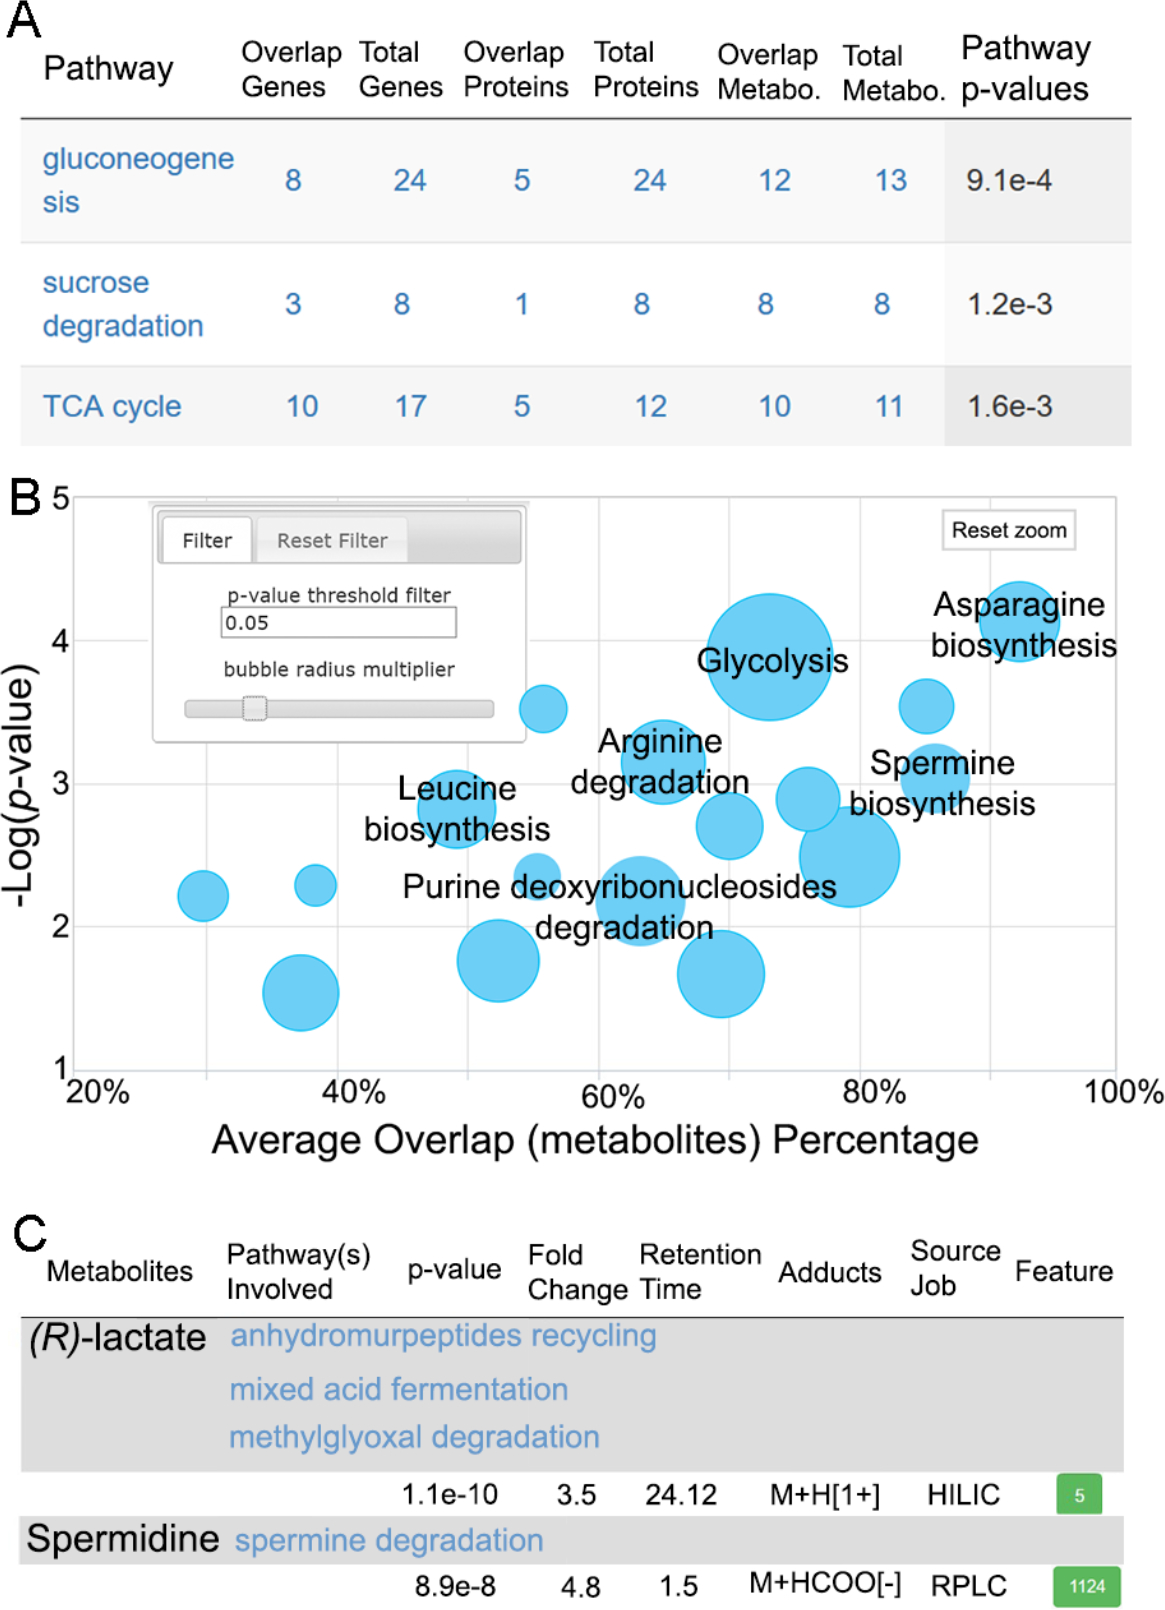
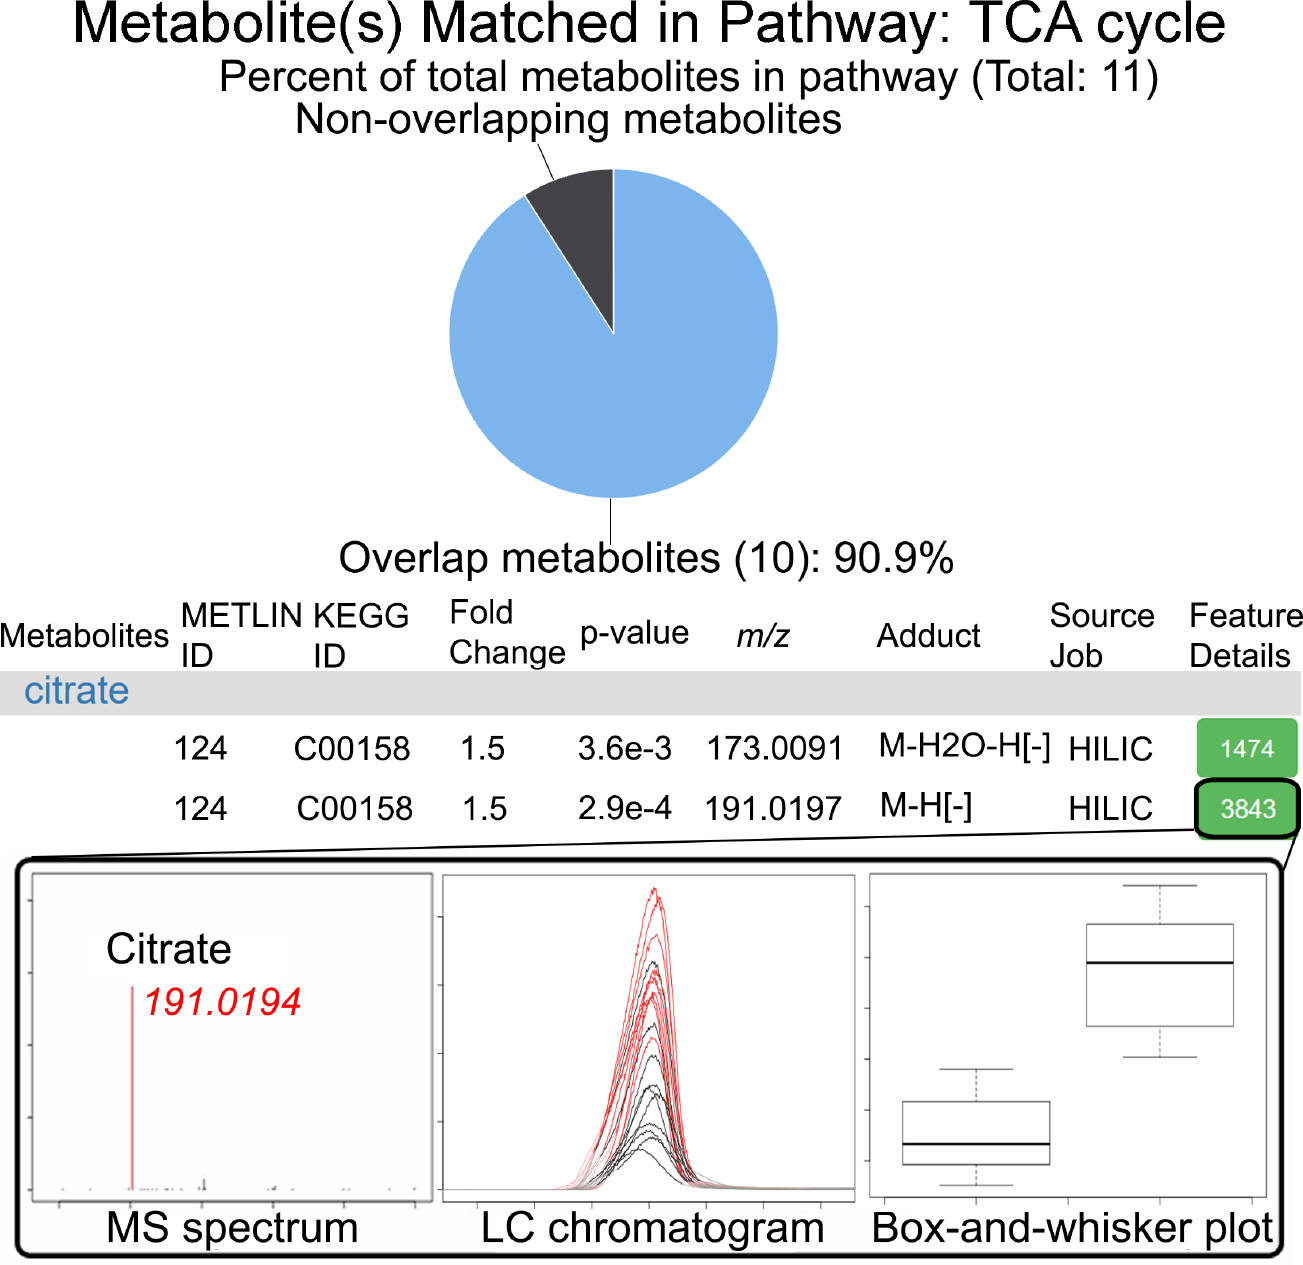
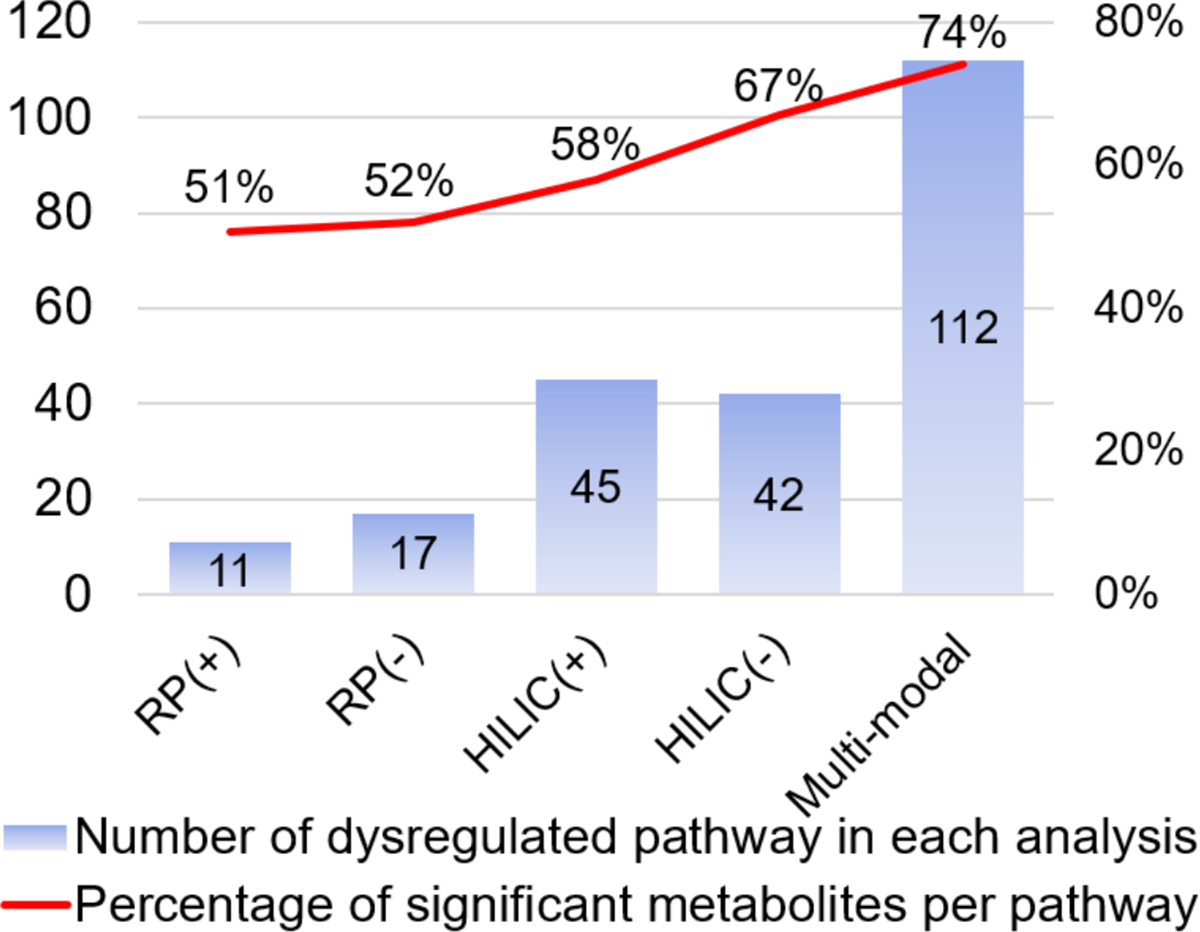
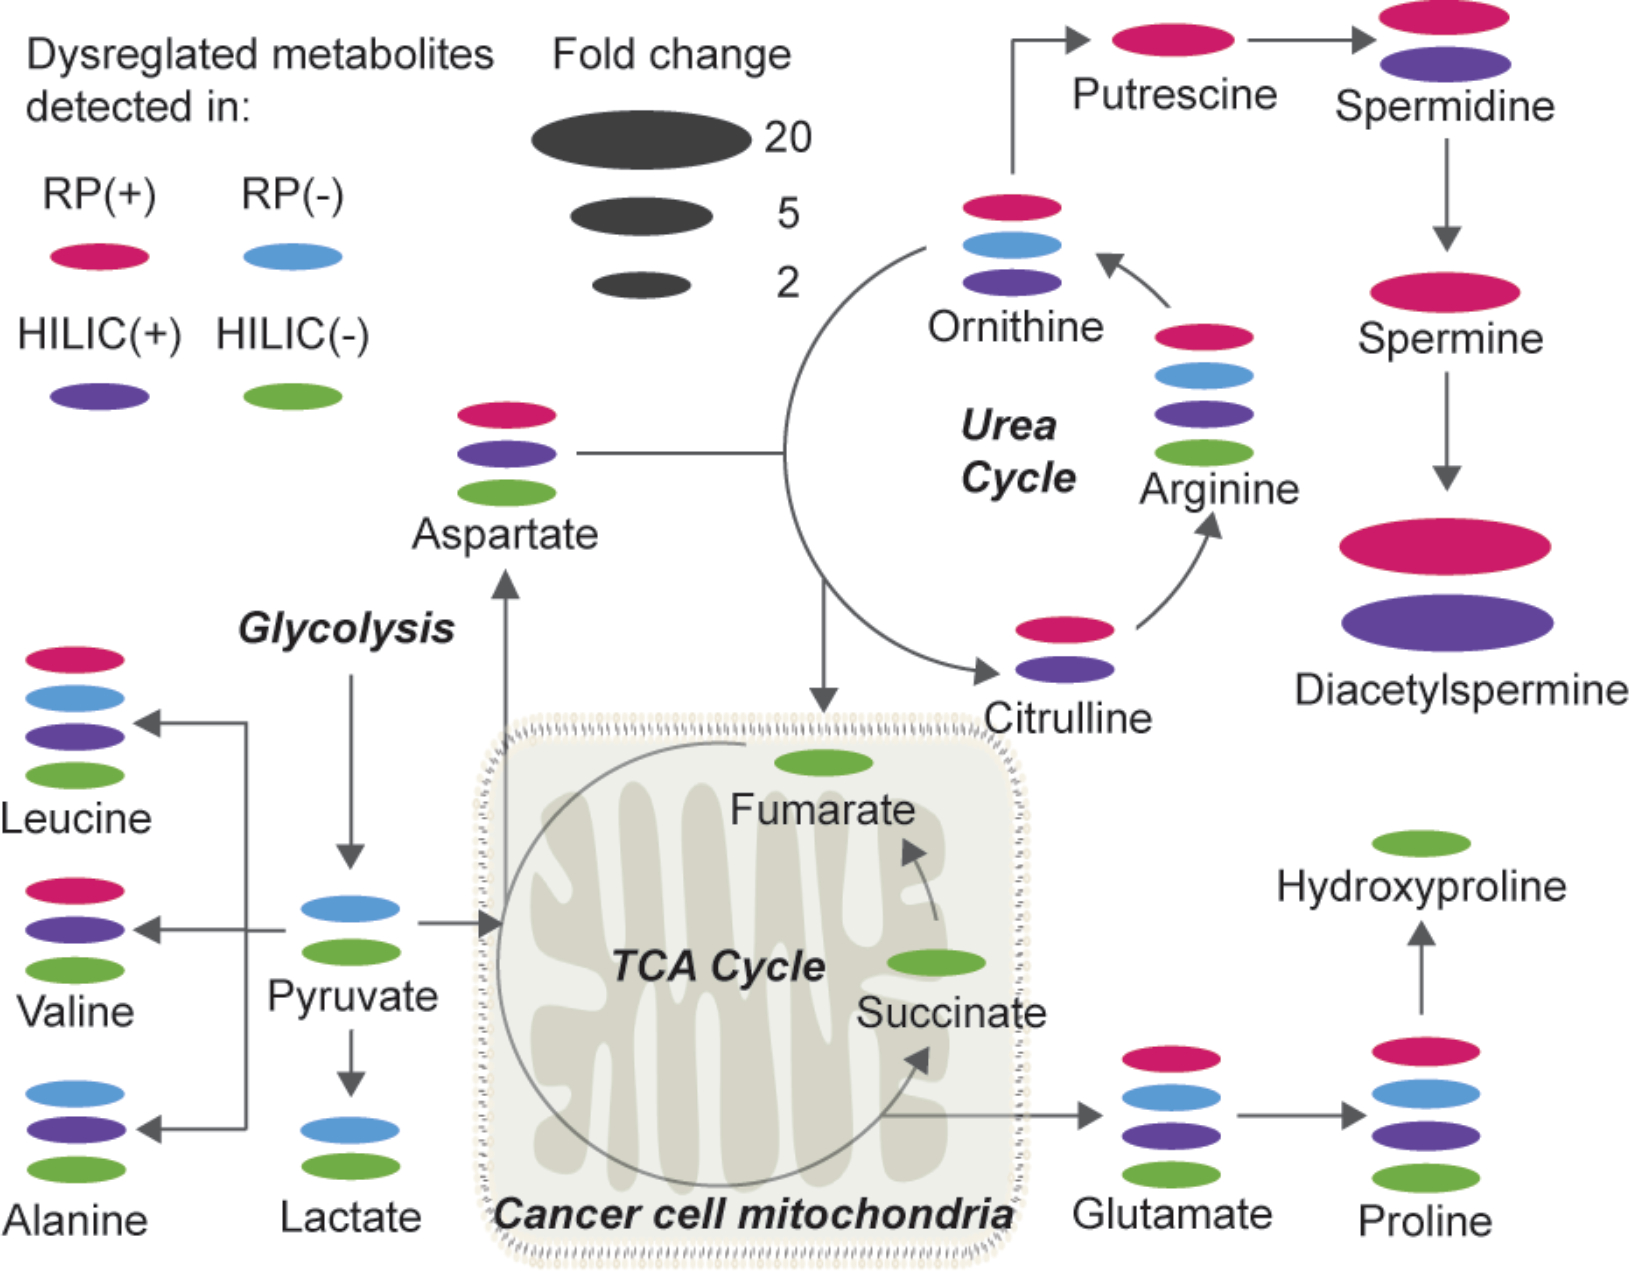
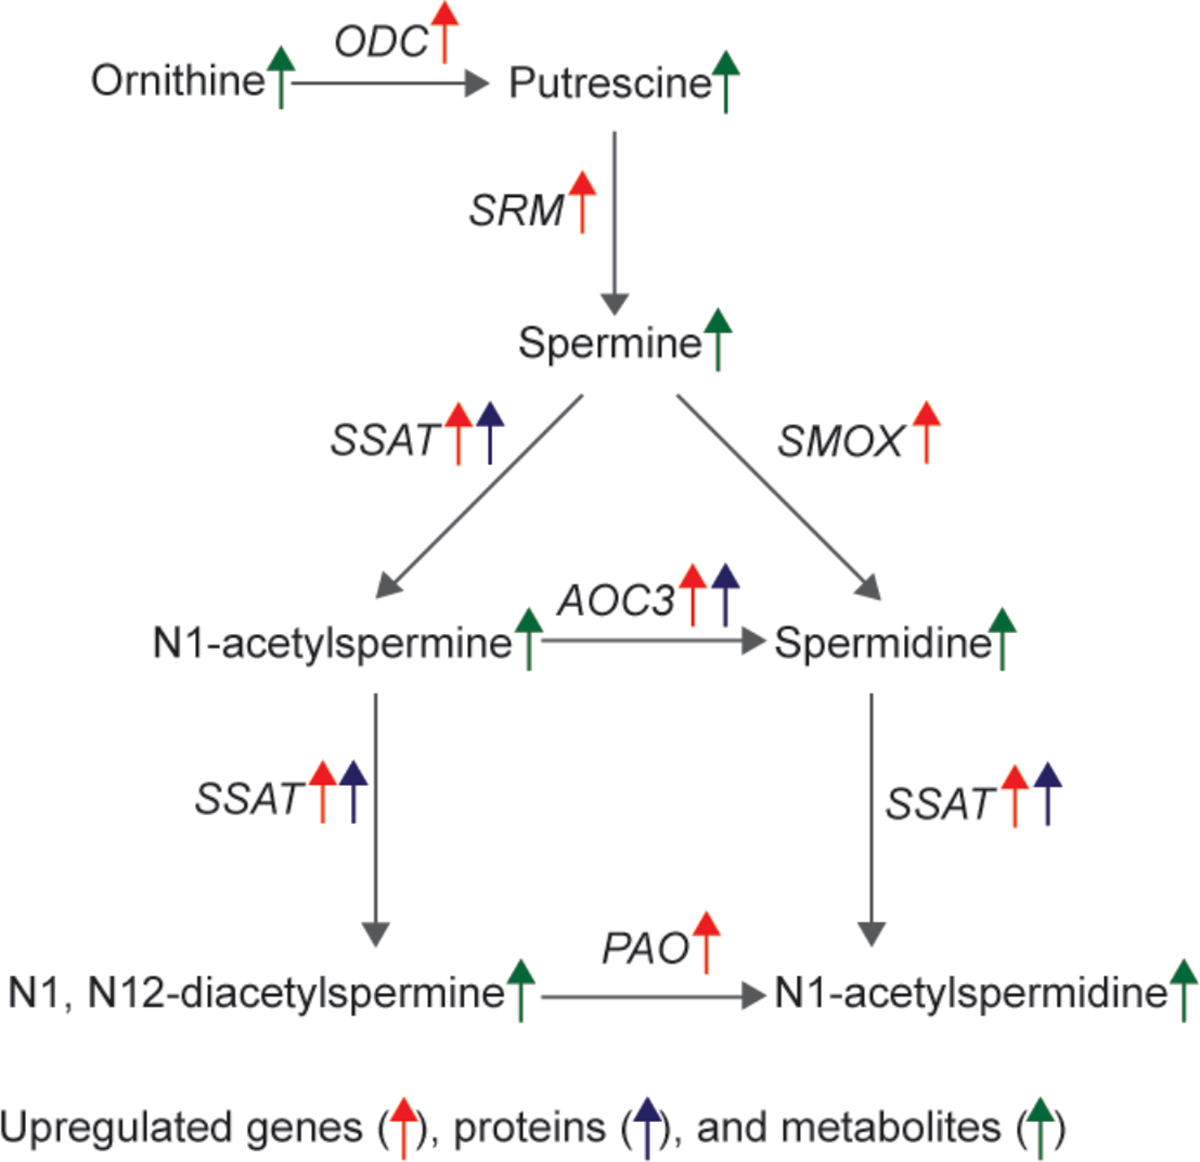
Comprehensive metabolomic data can be achieved using multiple orthogonal separation and mass spectrometry (MS) analytical techniques. However, drawing biologically relevant conclusions from this data and combining it with additional layers of information collected by other omic technologies present a significant bioinformatic challenge. To address this, a data processing approach was designed to automate the comprehensive prediction of dysregulated metabolic pathways/networks from multiple data sources. The platform autonomously integrates multiple MS-based metabolomics data types without constraints due to different sample preparation/extraction, chromatographic separation, or MS detection method. This multimodal analysis streamlines the extraction of biological information from the metabolomics data as well as the contextualization within proteomics and transcriptomics data sets. As a proof of concept, this multimodal analysis approach was applied to a colorectal cancer (CRC) study, in which complementary liquid chromatography-mass spectrometry (LC-MS) data were combined with proteomic and transcriptomic data. Our approach provided a highly resolved overview of colon cancer metabolic dysregulation, with an average 17% increase of detected dysregulated metabolites per pathway and an increase in metabolic pathway prediction confidence. Moreover, 95% of the altered metabolic pathways matched with the dysregulated genes and proteins, providing additional validation at a systems level. The analysis platform is currently available via the XCMS Online ( XCMSOnline.scripps.edu ).


Conflict of interest statement

Conflict of Interest Disclosure

The authors declare no competing financial interest.

Figures

Figure 1.
Figure 1.
(A) The schematic of a multi-modal metabolomics workflow where the data processing is integrated from multiple analytical approaches. This is compared to a single analytical approach (RPLC-MS) that is traditionally used for pathway mapping (B).
Figure 2.
Figure 2.
Multi-modal pathway analysis results. (A) Summary of pathway analysis results. The numbers of overlapping gene and protein show up after uploading dysregulated gene and protein data for multi-omic data integration (B) Pathway cloud plot. Each metabolic pathway is represented by a bubble. Metabolic pathways with higher statistical significance are located in the top right corner, showing low p-value and high metabolic overlapping. (C) Feature analysis results. Metabolic features matching the same metabolite according to their m/z values and possible adduct formations are all listed.
Figure 3.
Figure 3.
Detailed metabolic feature information in each dysregulated pathway. Metabolic feature details for each dysregulated pathway can be accessed by clicking on the number of overlapping metabolites in the pathway analysis results table (Figure 2A). The pie chart on the top shows the number percentage of the overlapping and non-overlapping metabolites detected in all analyses. For each metabolic feature, the green feature ID button allows users to get detailed MS information including the LC chromatogram, MS spectrum, and box-and-whisker plot so that visual checking of the feature quality is available to assist the metabolite confirmation. If one dysregulated metabolite is detected in multiple analytical platforms, all the dysregulated metabolic features will be listed, along with their IDs of the associated analytical platforms.
Figure 4.
Figure 4.
Number of significantly dysregulated pathways and dysregulated metabolites per pathway from RP(+), RP(−), HILIC(+), HILIC(−) and multi-modal analyses. Blue columns represent the number of statistically significant pathways (p-value ≤ 0.05) observed in each metabolomic analysis. Red line shows the average percentage of significantly dysregulated metabolites involved in dysregulated pathways in each metabolomics analysis. The percentage value is determined by first calculating the percentage of dysregulated metabolites out of all the metabolites involved in each pathway and then averaging the percentages across all the dysregulated pathways.
Figure 5.
Figure 5.
Colon cancer-associated metabolic dysregulations illustrated by metabolic network developed from multi-modal metabolomics pathway analysis in multi-modal XCMS.
Figure 6.
Figure 6.
Systems-level interpretation of the dysregulated spermine and spermidine metabolism pathway. ODC, ornithine decarboxylase; SRM, spermidine synthase; SSAT, spermidine/spermine N1-acetyltransferase; SMOX, spermine oxidase; AOC3, membrane primary amine oxidase; PAO, polyamine oxidase.

References

    1. Wen W; Li D; Li X; Gao Y; Li W; Li H; Liu J; Liu H; Chen W; Luo J Nature communications 2014, 5. - PMC - PubMed
    1. Bogdanov M; Matson WR; Wang L; Matson T; Saunders-Pullman R; Bressman SS; Beal MF Brain 2008, 131, 389–396. - PubMed
    1. Johnson CH; Ivanisevic J; Siuzdak G Nature reviews Molecular cell biology 2016, 17, 451. - PMC - PubMed
    1. Guijas C; Montenegro-Burke JR; Warth B; Spilker ME; Siuzdak G Nature Biotechnology 2018, 90, 3156–3164. . - PMC - PubMed
    1. Ivanisevic J; Zhu Z-J; Plate L; Tautenhahn R; Chen S; O’Brien PJ; Johnson CH; Marletta MA; Patti GJ; Siuzdak G Analytical chemistry 2013, 85, 6876–6884. - PMC - PubMed

Publication types