

Removal of hyperpolarized 129 Xe gas-phase contamination in spectroscopic imaging of the lungs
- PMID: 29893992
- PMCID: PMC6291357
- DOI: 10.1002/mrm.27349
Removal of hyperpolarized 129 Xe gas-phase contamination in spectroscopic imaging of the lungs
Abstract
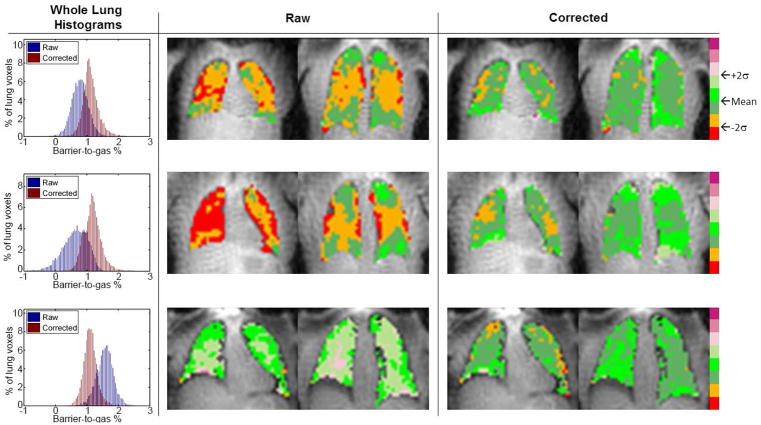
Purpose: A novel technique is presented for retrospective estimation and removal of gas-phase hyperpolarized Xenon-129 (HP 129 Xe) from images of HP 129 Xe dissolved in the barrier (comprised of parenchymal lung tissue and blood plasma) and red blood cell (RBC) phases. The primary aim is mitigating RF pulse performance limitations on measures of gas exchange (e.g., barrier-gas and RBC-gas ratios). Correction for gas contamination would simplify technical dissemination of HP 129 Xe applications across sites with varying hardware performance, scanner vendors, and models.
Methods: Digital lung phantom and human subject experiments (N = 8 healthy; N = 1 with idiopathic pulmonary fibrosis) were acquired with 3D radial trajectory and 1-point Dixon spectroscopic imaging to assess the correction method for mitigating barrier and RBC imaging artifacts. Dependence of performance on TE, image SNR, and gas contamination level were characterized. Inter- and intra-subject variation in the dissolved-phase ratios were quantified and compared to human subject experiments before and after correction.
Results: Gas contamination resulted in image artifacts similar to those in disease that were mitigated after correction in both simulated and human subject data; for simulation experiments performance varied with TE, but was independent of image SNR and the amount of gas contamination. Artifacts and variation of barrier and RBC components were reduced after correction in both simulation and healthy human lungs (barrier, P = 0.01; RBC, P = 0.045).
Conclusion: The proposed technique significantly reduced regional variations in barrier and RBC ratios, separated using a 1-point Dixon approach, with improved accuracy of dissolved-phase HP 129 Xe images confirmed in simulation experiments.
Keywords: artifact correction; hyperpolarized MRI; idiopathic pulmonary fibrosis; lung; spectroscopic imaging; xenon MRI.
© 2018 International Society for Magnetic Resonance in Medicine.
Figures


Similar articles
-
Dissolved 129 Xe lung MRI with four-echo 3D radial spectroscopic imaging: Quantification of regional gas transfer in idiopathic pulmonary fibrosis.Magn Reson Med. 2021 May;85(5):2622-2633. doi: 10.1002/mrm.28609. Epub 2020 Nov 30. Magn Reson Med. 2021. PMID: 33252157
-
Hyperpolarized 129 Xe gas transfer MRI: the transition from 1.5T to 3T.Magn Reson Med. 2018 Dec;80(6):2374-2383. doi: 10.1002/mrm.27377. Epub 2018 Jul 19. Magn Reson Med. 2018. PMID: 30024058 Free PMC article.
-
Removal of off-resonance xenon gas artifacts in pulmonary gas-transfer MRI.Magn Reson Med. 2021 Aug;86(2):907-915. doi: 10.1002/mrm.28737. Epub 2021 Mar 4. Magn Reson Med. 2021. PMID: 33665905 Free PMC article.
-
Hyperpolarized 129Xe MRI at low field: Current status and future directions.J Magn Reson. 2023 Mar;348:107387. doi: 10.1016/j.jmr.2023.107387. Epub 2023 Jan 27. J Magn Reson. 2023. PMID: 36731353 Review.
-
New Developments in Imaging Idiopathic Pulmonary Fibrosis With Hyperpolarized Xenon Magnetic Resonance Imaging.J Thorac Imaging. 2019 Mar;34(2):136-150. doi: 10.1097/RTI.0000000000000392. J Thorac Imaging. 2019. PMID: 30801449 Free PMC article. Review.
Cited by
-
A thermally polarized, dissolved-phase 129Xe phantom for quality-control and multisite comparisons of gas-exchange imaging.J Magn Reson. 2025 Feb;371:107829. doi: 10.1016/j.jmr.2025.107829. Epub 2025 Jan 13. J Magn Reson. 2025. PMID: 39809025
-
Design and Implementation of a Multi-Center Trial of 129Xe Gas Exchange MRI and MRS to Evaluate Longitudinal Progression of COPD.J Magn Reson Imaging. 2025 Apr 23:10.1002/jmri.29769. doi: 10.1002/jmri.29769. Online ahead of print. J Magn Reson Imaging. 2025. PMID: 40266001
-
Preclinical hyperpolarized 129 Xe MRI: ventilation and T2 * mapping in mouse lungs at 7 T using multi-echo flyback UTE.NMR Biomed. 2020 Jul;33(7):e4302. doi: 10.1002/nbm.4302. Epub 2020 Apr 14. NMR Biomed. 2020. PMID: 32285574 Free PMC article.
-
Hyperpolarized 129Xe Magnetic Resonance Imaging for Functional Avoidance Treatment Planning in Thoracic Radiation Therapy: A Comparison of Ventilation- and Gas Exchange-Guided Treatment Plans.Int J Radiat Oncol Biol Phys. 2021 Nov 15;111(4):1044-1057. doi: 10.1016/j.ijrobp.2021.07.002. Epub 2021 Jul 13. Int J Radiat Oncol Biol Phys. 2021. PMID: 34265395 Free PMC article.
-
A decay-modeled compressed sensing reconstruction approach for non-Cartesian hyperpolarized 129Xe MRI.Magn Reson Med. 2024 Oct;92(4):1363-1375. doi: 10.1002/mrm.30188. Epub 2024 Jun 11. Magn Reson Med. 2024. PMID: 38860514
References
-
- Driehuys B, Martinez-Jimenez S, Cleveland ZI, Metz GM, Beaver DM, Nouls JC, Kaushik SS, Firszt R, Willis C, Kelly KT, Wolber J, Kraft M, McAdams HP. Chronic Obstructive Pulmonary Disease: Safety and Tolerability of Hyperpolarized Xe-129 MR Imaging in Healthy Volunteers and Patients. Radiology. 2012;262(1):279–289. - PMC - PubMed
-
- Chen RY, Fan FC, Kim S, Jan KM, Usami S, Chien S. Tissue-blood partition coefficient for xenon: temperature and hematocrit dependence. J Appl Physiol. 1980;49(2):178–183. - PubMed
-
- Mugler JP, III, Altes TA, Ruset IC, Dregely IM, Mata JF, Miller GW, Ketel S, Ketel J, Hersman FW, Ruppert K. Simultaneous magnetic resonance imaging of ventilation distribution and gas uptake in the human lung using hyperpolarized xenon-129. Proc Natl Acad Sci USA. 2010;107:21707–21712. - PMC - PubMed
-
- Mugler JP, Altes TA, Ruset IC, Miller GW, Mata JF, Qing K, Tsentalovich I, Hersman FW, Ruppert K. Image-based measurement of T2* for dissolved-phase Xe129 in the human lung. Proceedings of the International Society for Magnetic Resonance in Medicine; Melbourne, Australia. 2012.
Publication types
MeSH terms
Substances
Grants and funding
LinkOut - more resources
Full Text Sources
Other Literature Sources
Research Materials
Miscellaneous
