. 2018 Oct;33(10):1785-1798.
doi: 10.1002/jbmr.3477. Epub 2018 Jun 26.

Folliculin Regulates Osteoclastogenesis Through Metabolic Regulation

Affiliations

Folliculin Regulates Osteoclastogenesis Through Metabolic Regulation

Masaya Baba et al. J Bone Miner Res. 2018 Oct.

Abstract

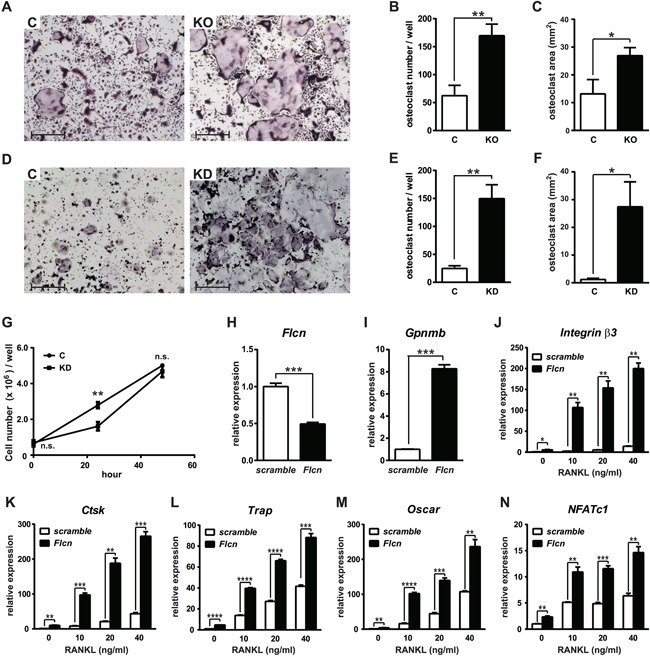
Osteoclast differentiation is a dynamic differentiation process, which is accompanied by dramatic changes in metabolic status as well as in gene expression. Recent findings have revealed an essential connection between metabolic reprogramming and dynamic gene expression changes during osteoclast differentiation. However, the upstream regulatory mechanisms that drive these metabolic changes in osteoclastogenesis remain to be elucidated. Here, we demonstrate that induced deletion of a tumor suppressor gene, Folliculin (Flcn), in mouse osteoclast precursors causes severe osteoporosis in 3 weeks through excess osteoclastogenesis. Flcn-deficient osteoclast precursors reveal cell autonomous accelerated osteoclastogenesis with increased sensitivity to receptor activator of NF-κB ligand (RANKL). We demonstrate that Flcn regulates oxidative phosphorylation and purine metabolism through suppression of nuclear localization of the transcription factor Tfe3, thereby inhibiting expression of its target gene Pgc1. Metabolome studies revealed that Flcn-deficient osteoclast precursors exhibit significant augmentation of oxidative phosphorylation and nucleotide production, resulting in an enhanced purinergic signaling loop that is composed of controlled ATP release and autocrine/paracrine purinergic receptor stimulation. Inhibition of this purinergic signaling loop efficiently blocks accelerated osteoclastogenesis in Flcn-deficient osteoclast precursors. Here, we demonstrate an essential and novel role of the Flcn-Tfe3-Pgc1 axis in osteoclastogenesis through the metabolic reprogramming of oxidative phosphorylation and purine metabolism. © 2018 The Authors Journal of Bone and Mineral Research published by Wiley Periodicals, Inc. on behalf of American Society for Bone and Mineral Research (ASBMR).

Keywords: FOLLICULIN (FLCN); METABOLISM; OSTEOCLAST; OSTEOPOROSIS; TRANSCRIPTION FACTORS.


Figures

Figure 1
Figure 1
Severe osteoporosis with increased osteoclast number and accelerated bone absorption in bone marrow targeted Flcn KO mice. (A) Representative images showing μCT of femora from Flcn f/f;Mx1‐Cre− (C: Flcn WT) mice (upper panel) and Flcn f/f;Mx1‐Cre+(KO: Flcn KO) mice (lower panel). Mice were treated with pIpC at 11 weeks of age and dissected 3 weeks after pIpC treatment. Flcn KO mice demonstrate dramatically reduced trabecular bone and thinner cortical bone with many abnormal dents. Scale bars = 2 mm. (B, C) Bone morphological parameters calculated from μCT scans demonstrate severe osteoporosis in Flcn KO mice. Data are presented as mean with SD (n = 5 mice for each group, unpaired t test: *p < 0.05). Bone volume fraction (BV/TV) and trabecular number (Tb.N) were significantly lower in Flcn KO mice. (D) Representative images of the Toluidine blue staining of femora from Flcn WT (C) (n = 5) and Flcn KO (KO) (n = 4) mice at 3 weeks after pIpC injection. Osteoclasts are indicated by arrowheads. Scale bars = 500 μm (left panel), 50 μm (right panel). (E–Q) Histomorphometric analysis on Toluidine blue–stained femora demonstrates osteoporosis and accelerated bone absorption. Data are presented as mean with SD (n = 5 for Flcn WT; n = 4 for Flcn KO, unpaired t test: n.s. = not significant, *p < 0.05, **p < 0.01, ***p < 0.001, ****p < 0.0001). (E–G) Bone volume (BV/TV), trabecular number (Tb.N), and trabecular separation (Tb.Sp) were significantly lower in Flcn KO mice. (H, I) Eroded surface (ES/BS) and osteoclast number (Oc.N/B.Pm) were significantly higher in Flcn KO mice. (J) Osteoclast surface (Oc.S/BS) was significantly higher in Flcn KO mice. (K–N) Osteoblast surface (Ob.S/BS), osteoid volume (OV/BV), and osteoid surface (OS/BS) did not show statistical significance between Flcn WT and Flcn KO mice. (O–Q) Dynamic bone histomorphometric analysis with calcein labeling demonstrated no significant difference in dynamic bone formation parameters, including mineral apposition rate (MAR), mineralizing surface (MS/BS), and bone formation rate (BFR/BS) between Flcn WT and Flcn KO mice.
Figure 2
Figure 2
Enhanced osteoclastogenesis in Flcn‐deficient osteoclast precursor cells. (A) Osteoclast precursors from Flcn f/f;Mx1‐Cre− (C) mice and Flcn f/f;Mx1‐Cre+(KO) mice were cultured with M‐CSF (100 ng/mL) and RANKL (100 ng/mL) for 96 hours, followed by TRAP staining. More multinucleated TRAP‐positive osteoclasts were differentiated from Flcn‐deficient osteoclast precursor cells. Scale bars = 400 μm. (B) The number of multinucleated (3 or more nuclei) TRAP‐positive osteoclasts in 24‐well plates. (C) The area of multinucleated TRAP‐positive osteoclasts in 24‐well plates. There were significantly more osteoclasts differentiated from Flcn‐deficient osteoclast precursors. Data represent means ± SD (triplicate, unpaired t test: *p < 0.05, **p < 0.01). (D) Mouse osteoclast precursor cell line RAW264.7 cells were transfected with scramble siRNA (C) or Flcn siRNA (KD). At 24 hours after transfection, culture medium was changed to MEMα containing 40 ng/mL of RANKL and cultured for additional 120 hours for osteoclastic differentiation, followed by TRAP staining. Scale bars = 1 mm (E) The number of multinucleated (3 or more nuclei) TRAP‐positive osteoclasts in 24‐well plates. (F) The area of multinucleated TRAP‐positive osteoclasts in 24‐well plates. Data represent means ± SD (triplicate, unpaired t test: *p < 0.05, **p < 0.01). (G) RAW264.7 cells were transfected with scramble siRNA (C) or Flcn siRNA (KD) in 6‐well plates. At 24 hours after transfection, culture medium was changed to MEMα containing 40 ng/mL of RANKL and the number of Trypan blue–negative viable cells were counted at 0 hour, 24 hours, and 48 hours after the medium change. Data represent means ± SD (triplicate, unpaired t test: **p < 0.01). (H) Flcn knockdown was confirmed by qRT‐PCR on siRNA transfected RAW264.7 cells. (I) Elevated Gpnmb expression, a readout for Flcn deficiency, was observed in Flcn knockdown RAW264.7 cells. (J–N) RAW264.7 cells were transfected with scramble siRNA or Flcn siRNA. At 24 hours after transfection, culture medium was changed to differentiation medium containing different concentrations of RANKL. After additional 48 hours of culture with RANKL/MEMα, mRNA expression was measured by qRT‐PCR to evaluate osteoclastic differentiation. Readout genes for osteoclastogenesis including Integrin β3 (J), Cathepsin K (K), Trap (L), and Oscar (M) were expressed at significantly higher levels in Flcn knockdown cells. (N) The expression of Nfatc1 was elevated in Flcn knockdown cells even in the absence of RANKL stimulation. Data represent means ± SD (triplicate, unpaired t test: *p < 0.05, **p < 0.01, ***p < 0.001, ****p < 0.0001). Representative data from at least three independent experiments are shown.
Figure 3
Figure 3
Flcn regulates osteoclastogenesis partly through Tfe3‐Pgc1 axis. (A) Immunofluorescent staining of endogenous Tfe3 demonstrated nuclear localization of Tfe3 in shRNA mediated Flcn knockdown RAW264.7 cells, whereas control RAW264.7 cells revealed cytoplasmic localization of Tfe3. Blue: DAPI; red: Tfe3. Scale bars = 20 μm. (B, C) qRT‐PCR on RAW264.7 cell lines stably transfected with control‐shRNA vector and Flcn‐shRNA vector. Efficient Flcn knockdown was confirmed by lower Flcn mRNA expression (B) and elevated Gpnmb mRNA expression (C) by qRT‐PCR. (D) Flcn targeted or control shRNA encoding lentiviral vectors with puromycin resistance cassette were co‐infected with Tfe3 targeted or control shRNA encoding lentiviral vectors with Blasticidin resistance cassette into RAW264.7 cells in a 12‐well plate. At 24 hours after infection, medium was changed to selection medium containing 10 μg/mL of Puromycin and 6 μg/mL of Blasticidin. After the 48‐hour culture with selection medium, cells were reseeded with MEMα medium and cultured for an additional 72 hours, followed by harvest and qRT‐PCR. Efficient shRNA‐mediated Tfe3 knockdown was confirmed by qRT‐PCR. (E) Integrin β3 gene expression was quantified on the same samples in Fig. 3 D. Additional Tfe3 knockdown on Flcn knockdown RAW264.7 cells significantly suppressed Integrin β3 expression. (F) Immunofluorescent staining with anti‐TFE3 antibody on RAW264.7 cells expressing Tfe3‐GR (Tfe3‐GR#1), which were cultured without dexamethasone or with 100 nM of dexamethasone. Dexamethasone‐dependent forced nuclear translocation of Tfe3‐GR was observed. Blue: DAPI, red: Tfe3. Scale bars = 10 μm. (G–L) Tfe3‐GR cells were cultured for 48 hours with or without dexamethasone, followed by gene expression quantification by qRT‐PCR. (G) Gpnmb, a known transcriptional target gene of Tfe3, was significantly elevated by forced nuclear translocation of Tfe3. (H, I) Pgc1α and Pgc1β master transcriptional regulators of mitochondrial biogenesis were significantly elevated by Tfe3 nuclear localization. (J, K) Tfe3‐GR#1 cells were cultured with or without 100 nM of dexamethasone, followed by chromatin immunoprecipitation (ChIP) with control IgG and anti‐TFE3 antibody. Tfe3 binding to M‐box consensus sequences in the Pgc1α gene (J) and the Pgc1β gene (K) were quantified by qPCR on ChIP samples and the fold enrichments relative to the input chromatins were calculated. (L) The expression of Cytochrome c, a target gene of Pgc1, was quantified by qRT‐PCR. (M–O) qRT‐PCR results indicate that the expression of readout genes for osteoclast differentiation was dramatically induced by forced nuclear translocation of Tfe3 even without RANKL stimulation. (P) qRT‐PCR of Impdh2, which is a known target of MITF. Data represent means ± SD (triplicate, unpaired t test: *p < 0.05, **p < 0.01, ***p < 0.001, ****p < 0.0001). Representative data from at least three independent experiments are shown.
Figure 4
Figure 4
Significant metabolic changes in Flcn‐deficient osteoclast precursors. (A) Enrichment plots of gene set enrichment analysis (GSEA) (HALLMARK_OXIDATIVE_PHOSPHORYLATION: normalized enrichment score [NES] = 1.97, normalized p value [NOM p‐val] = 0.000, false discovery rate q value [FDR q‐val] = 0.000) Affymetrix GeneChip mediated comprehensive gene expression profiling was performed on RAW264.7 cells transfected with scramble siRNA or Flcn targeted siRNA. GSEA demonstrated that upregulated genes in Flcn‐deficient cells were significantly enriched in the oxidative phosphorylation gene set signature. (B–G) qRT‐PCR analysis of representative genes from the oxidative phosphorylation signature on RAW264.7 cells transfected with scramble siRNA (C) or Flcn targeted siRNA (KD). (H) The expression of Pgc1β, a master regulator for mitochondrial biogenesis in osteoclastogenesis, was significantly elevated in Flcn knockdown cells. Data represent means ± SD (triplicate, unpaired t test: *p < 0.05, **p < 0.01, ***p < 0.001, ****p < 0.0001). Representative data from three independent experiments are shown. (I–K) Mitochondrial membrane potential was measured by tetramethylrhodamine methyl ester (TMRM) staining of bone marrow cells from Flcn WT and KO mice at 14 days after pIpC injection. (I) Representative flow cytometry of Mac1 × TMRE. (J, K) Mean fluorescence intensity of TMRE in Mac1+ cells was measured and shown in a bar graph. Data are presented as mean with SD (n = 4 for WT and KO, unpaired t test: **p < 0.01). (L) Another significant enrichment plot by GSEA revealed significant positive correlation between upregulated genes in Flcn‐deficient RAW264.7 cells and the purine metabolism signature gene set. (KEGG_PURINE_METABOLISM: NES = 0.63, NOM p‐val = 0.002, FDR q‐val = 0.033). (M–O) qRT‐PCR analysis of representative genes from the purine metabolism signature on RAW264.7 cells transfected with scramble siRNA (C) or Flcn targeted siRNA (KD). (M) Rrm2, (N) Ak2, (O) Impdh2. Data represent means ± SD (triplicate, unpaired t test: *p < 0.05, **p < 0.01). Representative data from three independent experiments are shown.
Figure 5
Figure 5
Upregulated nucleotide production and oxidative phosphorylation in Flcn‐deficient osteoclast precursors. Comprehensive metabolome analysis was performed on siRNA transfected Raw264.7 cells by CE‐TOF/MS. Cells were transfected with siRNA followed by RANKL stimulation (40 ng/mL) after 24 hours of transfection and harvested after an additional 48 hours of culture. Amount of each metabolite was adjusted by cell number. Open bars indicate data of scramble siRNA transfected cells and closed bars indicate Flcn targeted siRNA transfected cells. Y axis indicates amol/cell. Data represent means ± SD (n = 3, unpaired t test: *p < 0.05, **p < 0.01, ***p < 0.001, ****p < 0.0001). Metabolites, including PRPP, which are produced by pentose phosphate pathway, were elevated in Flcn‐deficient cells. Purine nucleotides and adenosine were dramatically elevated in Flcn‐deficient cells.
Figure 6
Figure 6
Regulation of nucleotide production and purinergic signaling loop by Flcn. (A) A scheme showing the purinergic signaling loop, which consists of controlled ATP release, extracellular metabolism of purine nucleotides by ectonucleotidases (CD39, CD73), stimulation of purinergic receptors by ATP and adenosine, and import of adenosine by ENT. (B–G) Gene expression was quantified by qRT‐PCR on siRNA transfected RAW264.7 cells cultured under the same condition as the metabolomics analysis in Fig. 5. The molecules involved in this purinergic signaling loop were expressed at significantly higher levels in Flcn knockdown cells. (H) The cellular cAMP level was quantified in siRNA transfected RAW264.7 cells, which were cultured under the same condition as B–G. (I) A scheme showing the conditioned medium experiment. (J–M) Conditioned medium from RAW264.7 cells transfected with scramble siRNA or Flcn targeted siRNA was collected. Then experimental RAW264.7 cells transfected with scramble siRNA or Flcn targeted siRNA were cultured with these conditioned medium for 48 hours, followed by qRT‐PCR analysis to quantify expression levels of osteoclastogenesis marker genes. (N–Q) RAW264.7 cells transfected with scramble siRNA or Flcn siRNA followed by 24‐hour incubation and additional 48‐hour incubation with 40 ng/mL of RANKL and DMSO or 50 μM of CV1808 (an Adora2 agonist). The expression levels of readout genes for osteoclastogenesis were quantified by qRT‐PCR. Data represent means ± SD (triplicate, unpaired t test: *p < 0.05, **p < 0.01, ***p < 0.001, ****p < 0.0001). Representative data from at least three independent experiments are shown.
Figure 7
Figure 7
Flcn regulates osteoclastogenesis through a purinergic signaling loop. (A‐H) RAW264.7 cells transfected with scramble siRNA or Flcn siRNA followed by 24hr incubation and additional 48 hr incubation with RANKL stimulation at 40 ng/ml were treated with specific inhibitors for each molecule to block the purinergic signaling loop. The gene expression of readout genes for osteoclastogenesis, Integrin β3 and Oscar, was quantified by qRT‐PCR to see the effect of purinergic signaling inhibitors on osteoclastogenesis. Cells were treated as follows. (A, B) FCCP to block mitochondrial ATP production; (C, D) oATP to inhibit P2rx7; (E, F) Mefloquine to block controlled ATP release by Panx1, which cooperates with P2rx7; (G, H) adenosine deaminase (ADA) to reduce extracellular adenosine. Data represent means ± SD (triplicate, *p < 0.05, **p < 0.01, ***p < 0.001, ****p < 0.0001). Representative data from at least three independent experiments are shown. (I–N) TRAP staining of RAW264.7 cells transfected with Flcn siRNA or scrambled siRNA followed by RANKL stimulation at 40 ng/mL for 96 hours with inhibitors of purinergic signaling loop. Osteoclastogenesis in Flcn knockdown RAW264.7 cells was significantly enhanced relative to controls (I, J, Fig. 2 C), and was inhibited by 3 μM of FCCP (K), 100 μM of oATP (L), 5 μM of Mefloquine (M), or 0.02 U/mL of ADA (N). Scale bars = 2 mm. (O) The area of multinucleated TRAP‐positive osteoclasts for each treatment is shown. Significant reduction of osteoclast area by the inhibitors for purinergic signaling loop was observed. Data represent means ± SD (triplicate, ***p < 0.001, ****p < 0.0001). Representative data from at least three independent experiments are shown. Scale bars = 2 mm. (P) A proposed model for metabolism‐mediated regulation of osteoclastogenesis by Flcn.

References

    1. Ishii KA, Fumoto T, Iwai K, et al. Coordination of PGC‐1beta and iron uptake in mitochondrial biogenesis and osteoclast activation. Nat Med. 2009;15(3):259–66. - PubMed
    1. Nishikawa K, Iwamoto Y, Kobayashi Y, et al. DNA methyltransferase 3a regulates osteoclast differentiation by coupling to an S‐adenosylmethionine‐producing metabolic pathway. Nat Med. 2015;21(3):281–7. - PubMed
    1. Lemma S, Sboarina M, Porporato PE, et al. Energy metabolism in osteoclast formation and activity. Int J Biochem Cell Biol. 2016;79:168–80. - PubMed
    1. Nickerson ML, Warren MB, Toro JR, et al. Mutations in a novel gene lead to kidney tumors, lung wall defects, and benign tumors of the hair follicle in patients with the Birt‐Hogg‐Dube syndrome. Cancer Cell. 2002;2(2):157–64. - PubMed
    1. Baba M, Furihata M, Hong SB, et al. Kidney‐targeted Birt‐Hogg‐Dube gene inactivation in a mouse model: Erk1/2 and Akt‐mTOR activation, cell hyperproliferation, and polycystic kidneys. J Natl Cancer Inst. 2008;100(2):140–54. - PMC - PubMed

Publication types

MeSH terms

Substances