. 2019 Jan/Feb;40(1):107-115.
doi: 10.1097/AUD.0000000000000617.

A "Goldilocks" Approach to Hearing Aid Self-Fitting: Ear-Canal Output and Speech Intelligibility Index

Affiliations

A "Goldilocks" Approach to Hearing Aid Self-Fitting: Ear-Canal Output and Speech Intelligibility Index

Carol Mackersie et al. Ear Hear. 2019 Jan/Feb.

Abstract

Objectives: The objective was to determine self-adjusted output response and speech intelligibility index (SII) in individuals with mild to moderate hearing loss and to measure the effects of prior hearing aid experience.

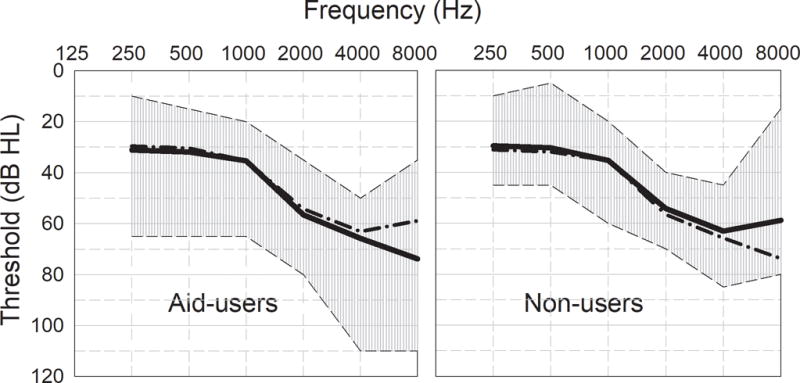
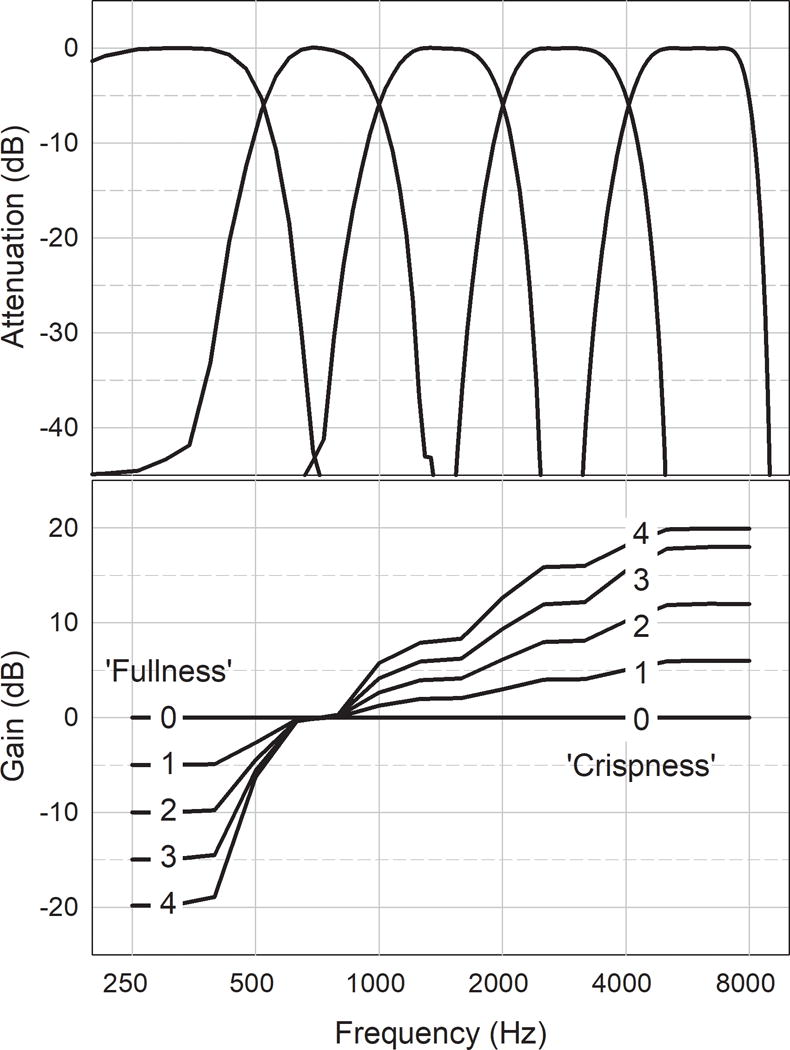
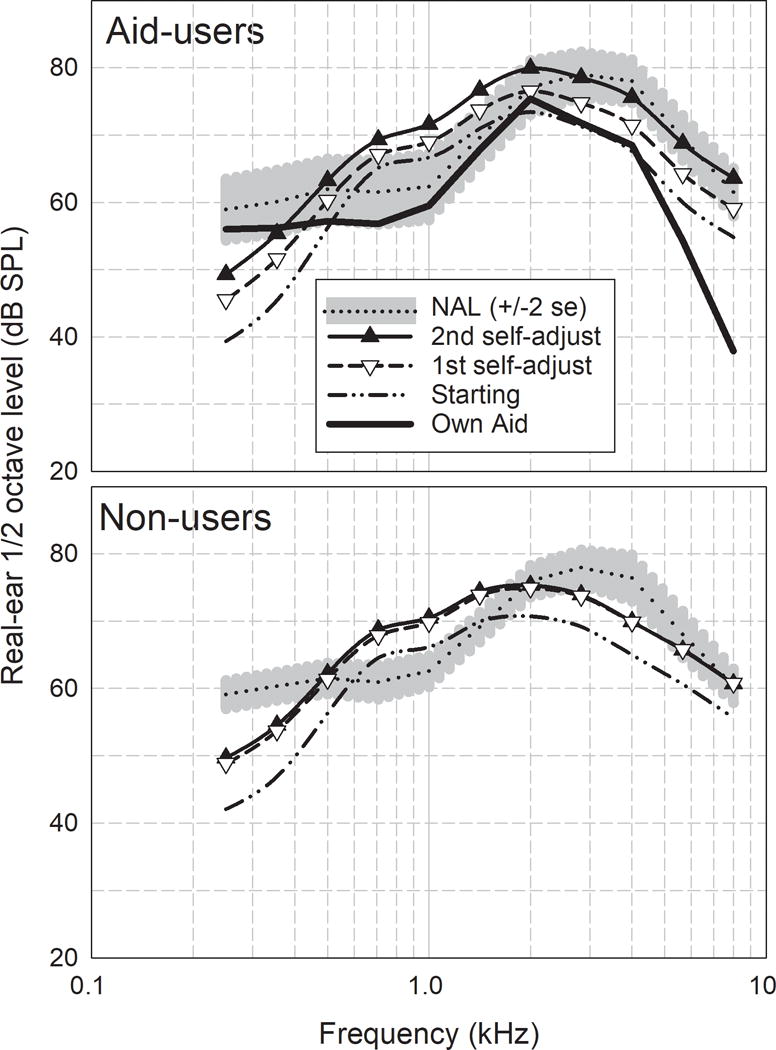
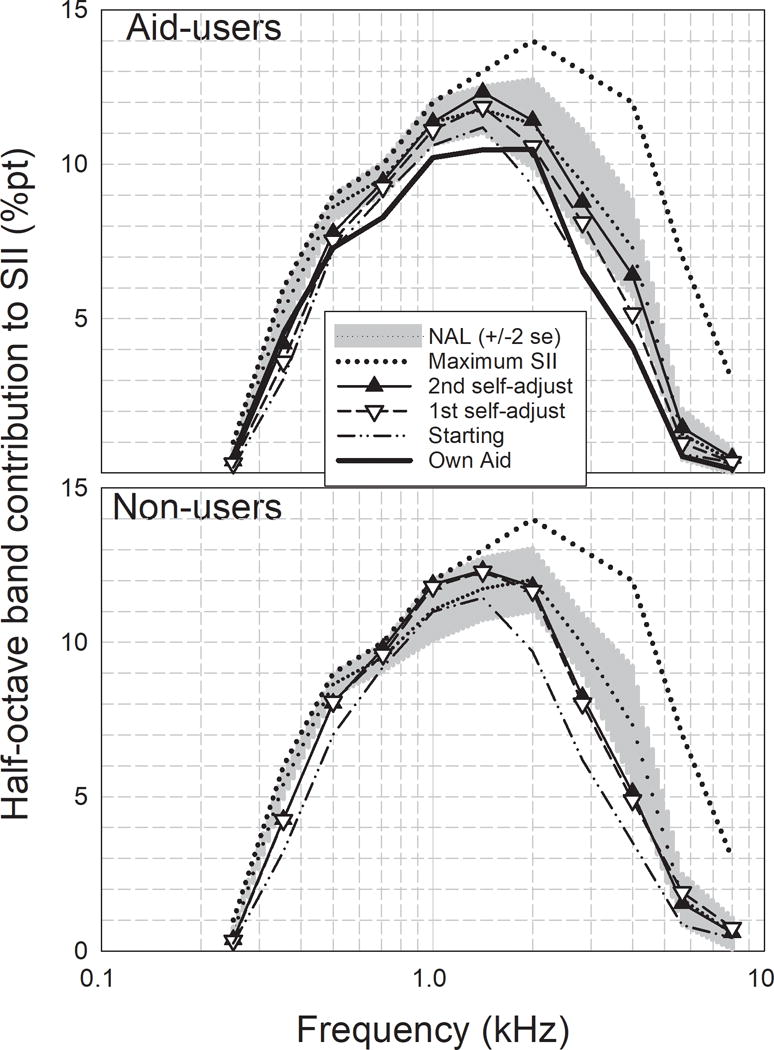
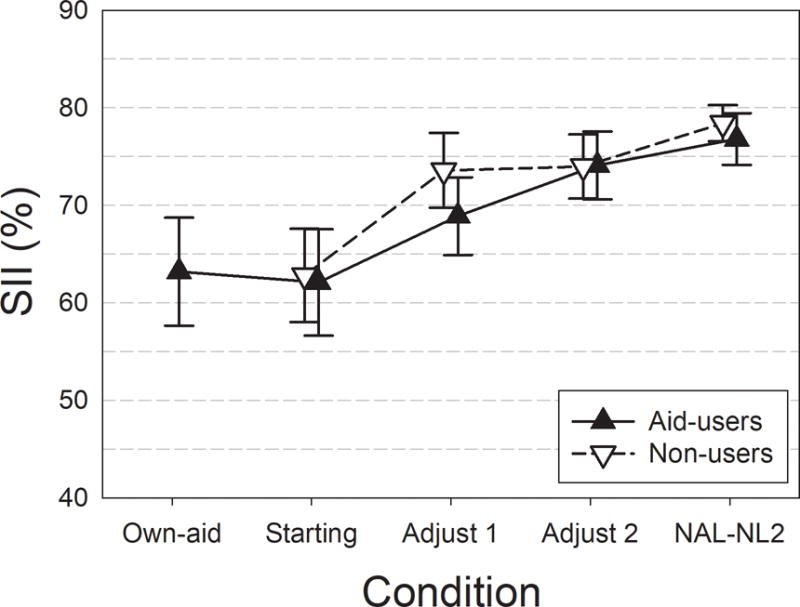
Design: Thirteen hearing aid users and 13 nonusers, with similar group-mean pure-tone thresholds, listened to prerecorded and preprocessed sentences spoken by a man. Starting with a generic level and spectrum, participants adjusted (1) overall level, (2) high-frequency boost, and (3) low-frequency cut. Participants took a speech perception test after an initial adjustment before making a final adjustment. The three self-selected parameters, along with individual thresholds and real-ear-to-coupler differences, were used to compute output levels and SIIs for the starting and two self-adjusted conditions. The values were compared with an NAL second nonlinear threshold-based prescription (NAL-NL2) and, for the hearing aid users, performance of their existing hearing aids.

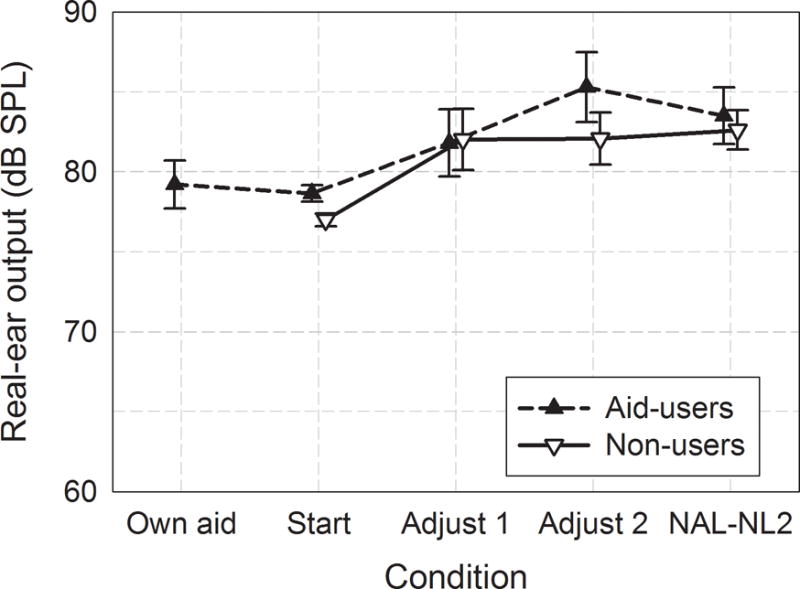
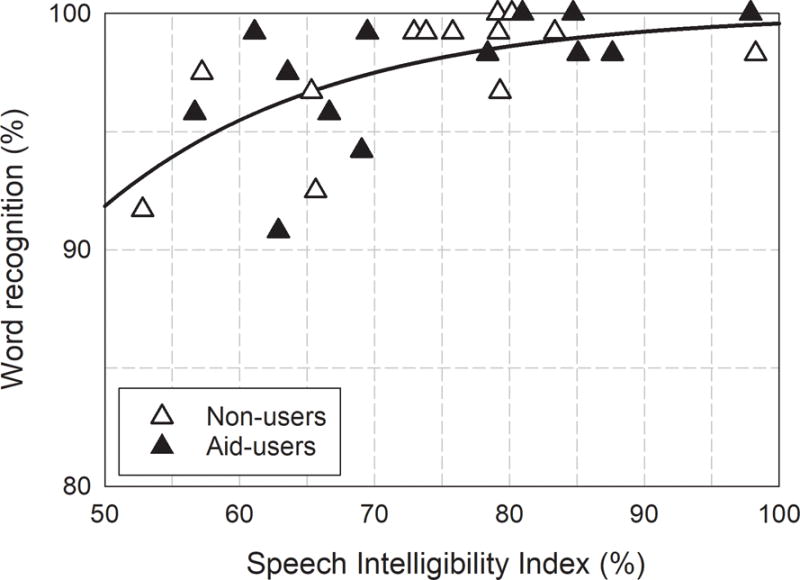
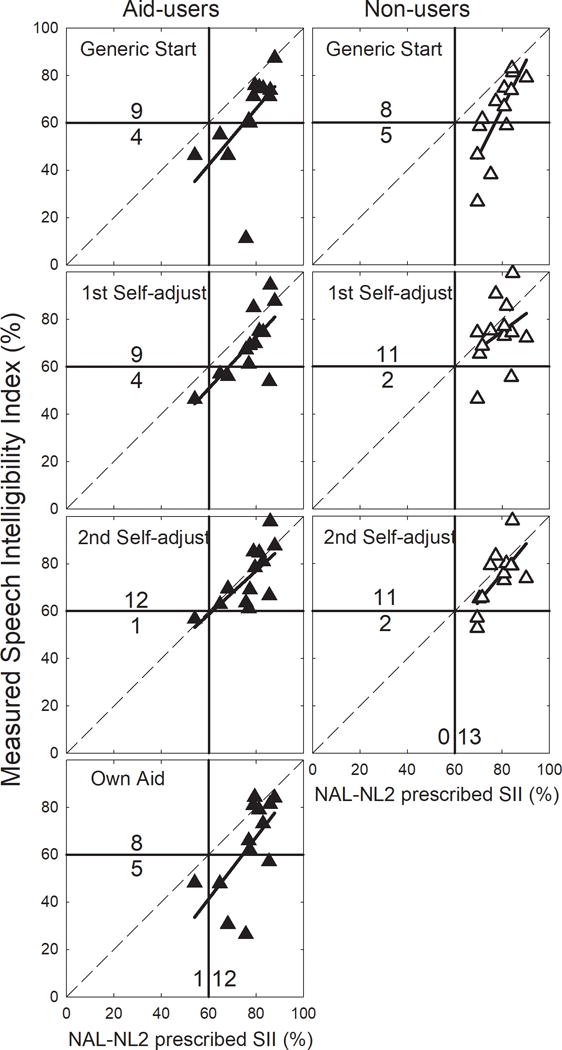
Results: All participants were able to complete the self-adjustment process. The generic starting condition provided outputs (between 2 and 8 kHz) and SIIs that were significantly below those prescribed by NAL-NL2. Both groups increased SII to values that were not significantly different from prescription. The hearing aid users, but not the nonusers, increased high-frequency output and SII significantly after taking the speech perception test. Seventeen of the 26 participants (65%) met an SII criterion of 60% under the generic starting condition. The proportion increased to 23 out of 26 (88%) after the final self-adjustment. Of the 13 hearing aid users, 8 (62%) met the 60% criterion with their existing hearing aids. With the final self-adjustment, 12 out of 13 (92%) met this criterion.

Conclusions: The findings support the conclusion that user self-adjustment of basic amplification characteristics can be both feasible and effective with or without prior hearing aid experience.


Figures

Figure 1
Figure 1
Mean and range of pure-tone thresholds for two participant groups. For ease of comparison, the means of the alternate group are shown by dash-dot lines.
Figure 2
Figure 2
The upper panel shows the characteristics of the five filters used to generate output spectra. The lower panel shows 25 frequency responses created by combining five levels of low-frequency cut (in steps of 5 dB) with five levels of high-frequency boost (in steps of 2 dB/octave).
Figure 3
Figure 3
Group-mean half-octave levels for the generic starting condition, two self-adjustments and the NAL-NL2 prescribed output for the experienced aids users (top) and non-users (bottom). Real-ear aided responses of the users’ own aid are shown as a thick solid line (top panel).
Figure 4
Figure 4
Overall rms output levels as functions of the listening condition. Error bars show ± 1 standard error.
Figure 5
Figure 5
Half-octave band contributions to SII for the starting and self-adjusted conditions. The shaded area shows the NAL-NL2 prescription (± 2 std.err.), The dotted line shows the frequency-importance function which represents the maximum possible contribution in each band.
Figure 6
Figure 6
Group-mean SII for aid-users and non-users as functions of the listening conditions. Error bars show ± 1 std.err.
Figure 7
Figure 7
Word recognition as a function of Speech Intelligibility Index after the second self-adjustment. The line shows a least-squares fit of the 26 data points to an exponential growth function. An SII of 60% predicts an average word-recognition score in excess of 95%.
Figure 8
Figure 8
Individual starting and self-adjusted SIIs as functions of NAL-NL2 prescribed SII. The number of participants falling above and below an SII criterion of 60% are shown. Solid lines show regression functions for measured versus prescribed SII.

References

    1. ANSI/ASA. S3.5-1997 American National Standard Methods for Calculation of the Speech Intelligibility Index R2012
    1. Boothroyd A, Mackersie CL. A “Goldilocks” approach to hearing-aid self-fitting: user interactions. Am J Audiology. 2017;26:430–435. - PMC - PubMed
    1. Convery E, Keidser G, Dillon H, Hartley L. A self-fitting hearing aid: need and concept. Trends Amplif. 2011;15:157–166. doi: 10.1177/1084713811427707. - DOI - PMC - PubMed
    1. Convery E, Keidser G, Seeto M, McLelland M. Evaluation of the Self-Fitting Process with a Commercially Available Hearing Aid. J Am Acad Audiol. 2017;28:109–118. doi: 10.3766/jaaa.15076. - DOI - PubMed
    1. Convery E, Keidser G, Seeto M, Yeend I, Freeston K. Factors affecting reliability and validity of self-directed automatic in situ audiometry: implications for self-fitting hearing AIDS. J Am Acad Audiol. 2015;26:5–18. doi: 10.3766/jaaa.26.1.2. - DOI - PubMed

Publication types