. 2018 Jun 12;13(6):e0198521.
doi: 10.1371/journal.pone.0198521. eCollection 2018.

CLASP promotes stable tethering of endoplasmic microtubules to the cell cortex to maintain cytoplasmic stability in Arabidopsis meristematic cells

Affiliations

CLASP promotes stable tethering of endoplasmic microtubules to the cell cortex to maintain cytoplasmic stability in Arabidopsis meristematic cells

P Yen Le et al. PLoS One. .

Abstract

Following cytokinesis in plants, Endoplasmic MTs (EMTs) assemble on the nuclear surface, forming a radial network that extends out to the cell cortex, where they attach and incorporate into the cortical microtubule (CMT) array. We found that in these post-cytokinetic cells, the MT-associated protein CLASP is enriched at sites of EMT-cortex attachment, and is required for stable EMT tethering and growth into the cell cortex. Loss of EMT-cortex anchoring in clasp-1 mutants results in destabilized EMT arrays, and is accompanied by enhanced mobility of the cytoplasm, premature vacuolation, and precocious entry into cell elongation phase. Thus, EMTs appear to maintain cells in a meristematic state by providing a structural scaffold that stabilizes the cytoplasm to counteract actomyosin-based cytoplasmic streaming forces, thereby preventing premature establishment of a central vacuole and rapid cell elongation.


Conflict of interest statement

The authors have declared that no competing interests exist.

Figures
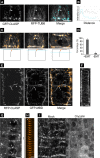
Fig 1
Fig 1. CLASP is enriched at EMT-cortex anchor points.
A. Surface view of a root tip epidermal cell co-expressing pCLASP::GFP-CLASP (cyan) and pUBQ1::RFP-TUB6 (gray). EMTs often extend into the cortex, and often link to GFP-CLASP at cell edges. Dotted lines indicate cell outline. Cell edge localization is indicated by asterisk. Bar, 5 μm. B. Fluorescence Intensity profile plot corresponding to the EMT-cortex anchor point from panel A. Dotted arrow is drawn next to the region for the plot for reference. Grey line = MTs; Cyan line = CLASP. C. Confocal sections through the cell in A, starting at the surface and moving in at 0.35 μm increments. Arrowhead traces an EMT into the cell interior. The position of each section is indicated by dot blue line in the illustration below. The square box, black line, and orange line illustrate root cell, EMT, and CLASP, respectively. D. Quantification of GFP-CLASP/RFP-TUB6 association. (n = 5 roots, 25 cells, and 316 CLASP spots). p < 0.01, Student’s t test. E. Confocal sections through the cell mid-planes of root tip epidermal cells co-expressing CLASP::TagRFP-CLASP and UBQ1::GFP-MBD, showing enrichment of RFP-CLASP (orange) at sites corresponding to EMT-cortex attachment points (arrows). MTs are visualized by GFP-MBD (grey). Bar, 5 μm. F. GFP-CLASP localization in an elongating root epidermal cell. GFP-CLASP decorates CMTs along their lengths. Cell edge and EMT-anchor enrichment is absent. Bar, 5 μm. G. Confocal sections through cell mid-planes of division stage cells with strong GFP-CLASP accumulation along EMT bundles (arrows). Bar, 5 μm. H. Time series montage showing GFP-CLASP enrichment at sites of stable EMT-cortex attachment (arrow). Intervals between frames is 32 sec, and total time is 16 minutes. Bar, 2.5 μm. I. Root tip epidermal cells expressing GFP-CLASP treated with oryzalin (50 μm, 45min) or mock (45min, 0.5% DMSO). Bar, 5 μm.
Fig 2
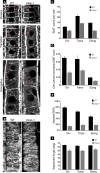
Fig 2. EMT phenotypes in clasp-1 plants.
A. Anti-tubulin immunofluorescence images of root tip epidermal cells of wild type (left) and clasp-1 (right). EMT abnormalities are seen in all three developmental stages. Cellular mid-planes are shown for each stage, using average Z-projections. Division stage shows average projections of 4 Z-slices, corresponding to 2 μm. Transition and elongation stages show average projections of 6 Z-slices corresponding to 3 μm. Bars, 5 μm. B. Anti-tubulin immunofluorescence images at the outer epidermal surface of root tip epidermal cells of wild type (left) and clasp-1 (right). Images are average projections of 4 Z-slices, corresponding to 2 μm. Bar, 5 μm. C. Total EMT numbers per cell in wild-type and clasp-1 root tip epidermal cells. EMT numbers are reduced in all three developmental stages in clasp-1 compared to wild type. n = 24 cells for each genotype; 800 ~ 1700 total EMTs wild type, 600 ~ 1000 EMTs in clasp-1; 3 roots in wild type and 5 roots in clasp-1. D. EMT numbers normalized for cell volumes (EMT number/cubic μm) in each developmental zone of wild type and clasp-1. Taking into account the larger cell volumes of clasp-1, the EMT reductions are more severe. E. Percentage of attached EMTs in clasp-1 compared to wild type in each developmental zone. n = 24 cells for each genotype; n = ~600 EMTs clasp-1 and ~1000 EMTs WT for each cell stage. F. The EMT attachment angles in clasp-1 are smaller than in wild type in each zone of the root tip. n = 12 cells each genotype, n = 60~100 EMTs clasp-1 and 300~400 EMTs WT for each cell stage.
Fig 3
Fig 3. Dynamics of EMT-cortex attachment in clasp-1.
A. Single time point image in the mid-plane of transition zone cell in both wild type (left) and clasp-1 (right) expressing UBQ1::GFP-MBD. The kymograph on the right side of each image correspond to the white dotted line. Arrowhead indicates EMT with lateral mobility in clasp-1. Time course t = 200 second (4 second intervals). Bars, 5 μm. B. Life histories of individual EMTs from a transition zone cell over the course of 200 second (4 second intervals). Different coloured traces correspond to individual. Images are tilted 3D projections. The rear and side walls are kymographs for spatial and temporal reference. Bar, 5 μm. C. Histogram showing EMT-cortex attachment times for wild type and clasp-1. Since most EMTs remained attached beyond the duration of the observation in wild type, these are grouped as ‘more’. n = 5 roots each genotype, 5 cells per root, 100 EMTs. D. Time series images showing establishment of stable EMT-cortex attachment in wild type and failed attachments in clasp-1. Green arrowheads indicate growing ends; red arrowheads indicate shrinking ends; asterisks indicate onset of EMT encounter with cortex (on left). Two examples of clasp-1 are shown. Top panel is brief encounter without MT bending, and bottom panel is brief encounter with bending. The time series is 180s in wild type and 70s in clasp-1 top panel, and 60s in clasp-1 bottom panel. Bars, 3μm.
Fig 4
Fig 4. Globular vacuole appearance and cytoplasmic instability in clasp-1 mutant.
A. Vacuole morphology of transition stage cells were visualized by BCECF (100μM) and presented in single view (top) and 3D view (bottom) in both wild type and clasp-1. Red is propidium iodide. Bars, 10μm. B. Tonoplast morphology in expanding cotyledon cells of wild-type and clasp-1 plants expressing 35S::GFP-ɣTIP. Arrowheads indicate spherical dilations of vacuolar membranes in clasp-1. Bars, 10μm. C. Single time-point image of epidermal root division zone cells from wild-type and clasp-1 plants expressing UBQ1::eGFP. Bar, 5 μm. D. Time projection (standard deviation method) of cells in A showing the enhanced vacuole/cytoplasm movement in clasp-1. White areas indicate regions that underwent positional/morphological change over the course of observation. Images correspond to 120 second time-lapses, 4 second intervals. E. Color merge of two time points from same time series. Green is start and magenta is t = 120 seconds later. White areas indicate no movement between time points. F. Kymographs corresponding to the black line in the two-colour merged images in C. The enhanced cytoplasmic movements of clasp-1 appear as large dark areas of variable size, position, and duration. Total time is 120 seconds. G. Life histories of several vacuoles from transitioning cells of wild type and clasp-1. Different coloured traces correspond to individual vacuoles. Left image shows all time-points projected onto a single image frame for reference. Right images are tilted 3D projections. The rear and side walls are kymographs for spatial and temporal reference. Total time for each series is 160 second (4 second intervals). Bar, 5 μm. H. Variations in vacuolar area over time in wild-type and clasp-1 root epidermal cells. Time series were acquired at 4 second intervals for 80 seconds, and vacuolar coefficients of variation (co. var.) were calculated for each vacuole. The bars show the means ± SE of 30 vacuoles for each genotype in each cell stage.
Fig 5
Fig 5. Globular vacuole appearance and cytoplasmic instability in wild-type plants treated with oryzalin.
A. Single view (top) and 3D view (bottom) of vacuoles in wild-type transition stage cells. Vacuoles were visualized following staining with 10μm BCECF staining (10 μm) of mock (0.5% DMSO) and 50μm oryzalin-treated roots. Red is propidium iodide to visualize cell walls. Bars, 10μm. B. Cotyledon epidermal cells from wild-type plants expressing 35S::GFP-ɣTIP, treated for 30min with 50μm oryzalin (right), or mock 0.5% DMSO (left). Bars, 10μm. C. Single time-point images of root epidermal division zone cells from wild-type plants expressing UBQ::GFP-TUB6 treated with mock 0.5% DMSO or 50μm Oryzalin. Images were taken after 45 minutes of treatment. D. Time projection (standard deviation method) of cells in A showing the enhanced vacuole/cytoplasm movement in oryzalin-treated plants. White areas indicate regions that underwent positional/morphological change over the course of observation. Images correspond to 120 second time-lapses, 4 second intervals. E. Color merge of two time points from same time series. Green is t = 1 and magenta is t = 120. White areas indicate no movement between time points. F. Kymographs corresponding to yellow lines in the two-colour merged images. Enhanced dynamicity of vacuoles mirrors that observed in clasp-1 cells. Total time is120 seconds. Bars, 10μm. G. Life histories of individual vacuoles from a transition stage cell over the course of 160 seconds (4 second intervals). Different coloured traces correspond to individual vacuoles. Left image shows all time-points projected onto a single image frame for reference. Right images are tilted 3D projections. The rear and side walls are kymographs for spatial and temporal reference. Bars, 10μm. H. Coefficients of variation (co.var.) for vacuole area in control (0.5% DMSO) and roots treated with 50 μm oryzalin. Time between compared time points 80 second. n = 30 vacuoles for each genotype. Bars indicate Standard Error.

Similar articles

Cited by

References

    1. Baskin TI. On the alignment of cellulose microfibrils by cortical microtubules: a review and a model. Protoplasma. 2001;215(1–4):150–171. - PubMed
    1. Chan J, Crowell E, Eder M, Calder G, Bunnewell S, Findlay K, et al. The rotation of cellulose synthase trajectories is microtubule dependent and influences the texture of epidermal cell walls in Arabidopsis hypocotyls. J Cell Sci. 2010;123(Pt 20):3490–3495. doi: 10.1242/jcs.074641 - DOI - PubMed
    1. Fujita M, Himmelspach R, Hocart CH, Williamson RE, Mansfield SD, Wasteneys GO. Cortical microtubules optimize cell-wall crystallinity to drive unidirectional growth in Arabidopsis. Plant J. 2011;66(6):915–928. doi: 10.1111/j.1365-313X.2011.04552.x - DOI - PubMed
    1. Paredez AR, Somerville CR, Ehrhardt DW. Visualization of cellulose synthase demonstrates functional association with microtubules. Science. 2006. June 9;312(5779):1491–5. doi: 10.1126/science.1126551 - DOI - PubMed
    1. Collings DA, Wasteneys GO. Actin microfilament and microtubule distribution patterns in the expanding root of Arabidopsis thaliana. Can J Bot. 2005. June;83(6):579–90.

Publication types

MeSH terms

LinkOut - more resources