

Individual patient variability with the application of the kidney failure risk equation in advanced chronic kidney disease
- PMID: 29894480
- PMCID: PMC5997334
- DOI: 10.1371/journal.pone.0198456
Individual patient variability with the application of the kidney failure risk equation in advanced chronic kidney disease
Abstract
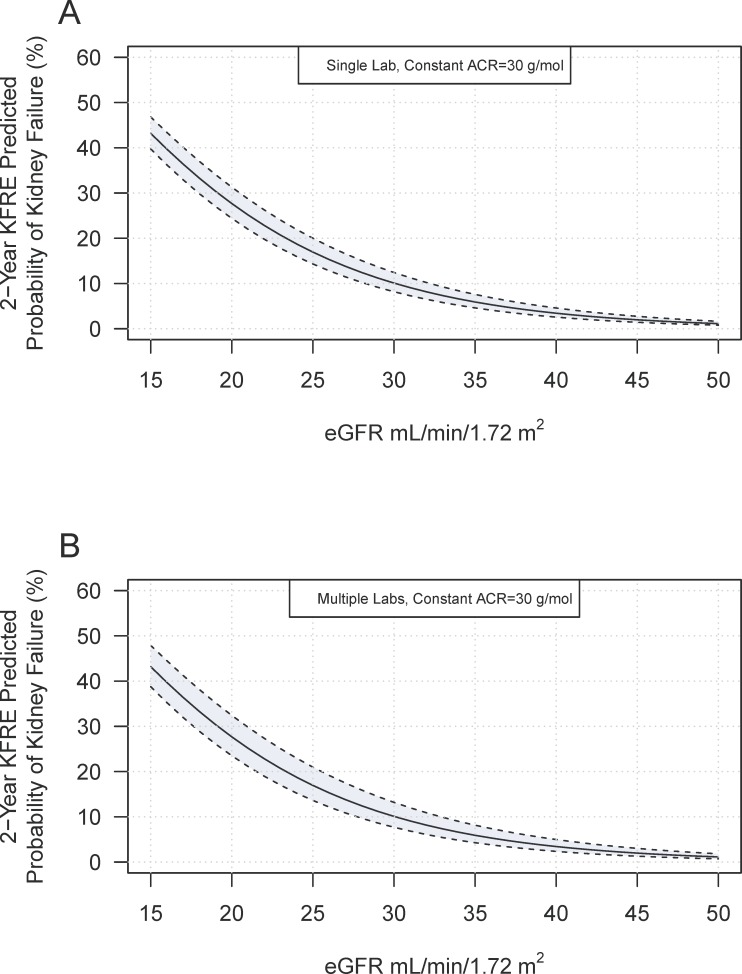
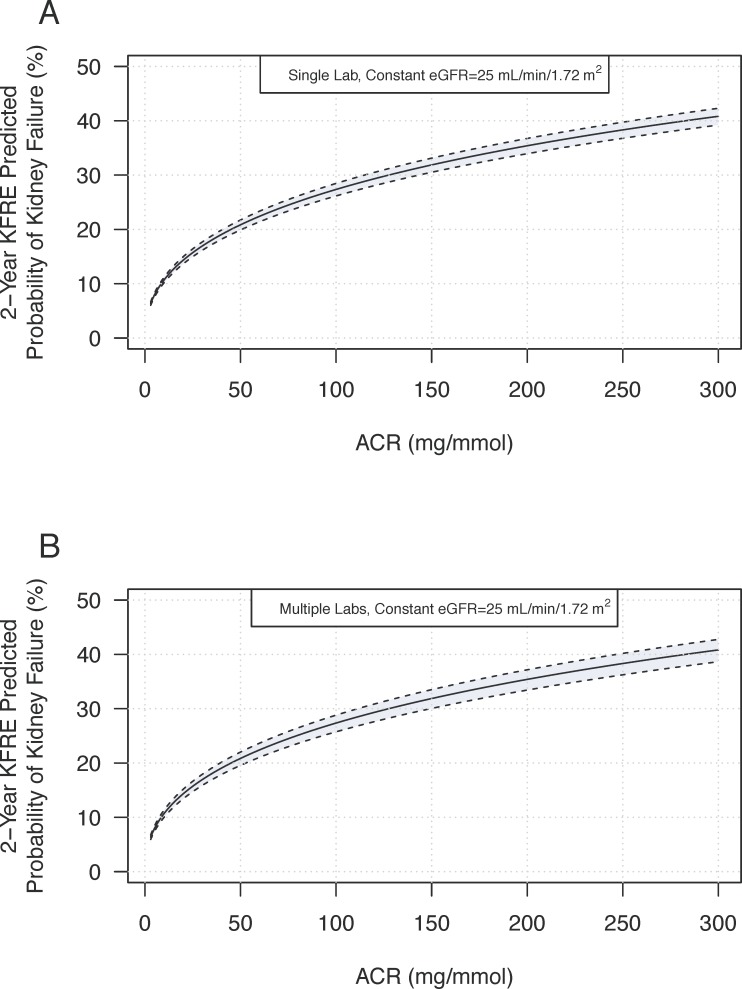
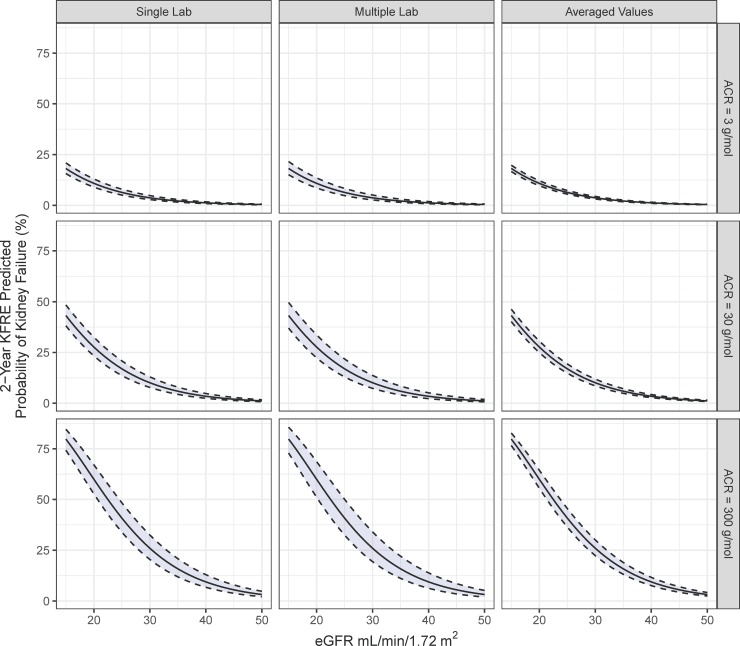
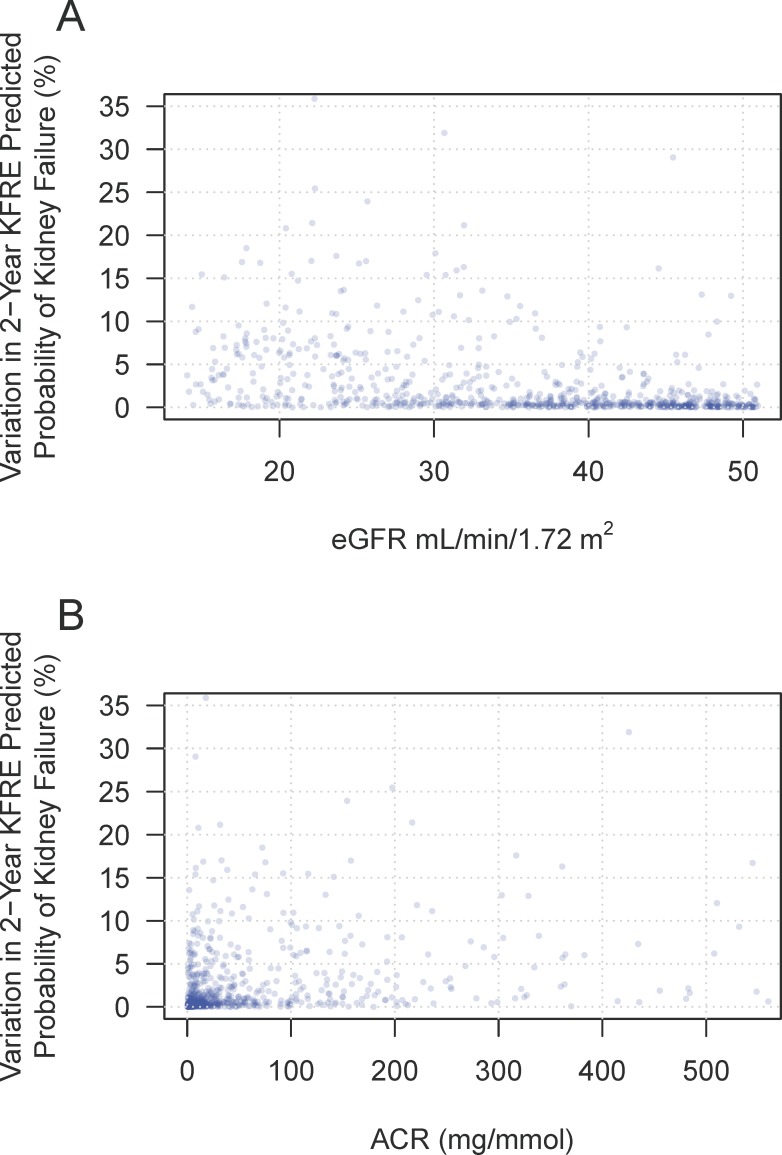
The Kidney Failure Risk Equation (KFRE) predicts the need for dialysis or transplantation using age, sex, estimated glomerular filtration rate (eGFR), and urine albumin to creatinine ratio (ACR). The eGFR and ACR have known biological and analytical variability. We examined the effect of biological and analytical variability of eGFR and ACR on the 2-year KFRE predicted kidney failure probabilities using single measure and the average of repeat measures of simulated eGFR and ACR. Previously reported values for coefficient of variation (CV) for ACR and eGFR were used to calculate day to day variability. Variation was also examined with outpatient laboratory data from patients with an eGFR between 15 and 50 mL/min/1.72 m2. A web application was developed to calculate and model day to day variation in risk. The biological and analytical variability related to ACR and eGFR lead to variation in the predicted probability of kidney failure. A male patient age 50, ACR 30 mg/mmol and eGFR 25, had a day to day variation in risk of 7% (KFRE point estimate: 17%, variability range 14% to 21%). The addition of inter laboratory variation due to different instrumentation increased the variability to 9% (KFRE point estimate 17%, variability range 13% to 22%). Averaging of repeated measures of eGFR and ACR significantly decreased the variability (KFRE point estimate 17%, variability range 15% to 19%). These findings were consistent when using outpatient laboratory data which showed that most patients had a KFRE 2-year risk variability of ≤ 5% (79% of patients). Approximately 13% of patients had variability from 5-10% and 8% had variability > 10%. The mean age (SD) of this cohort was 64 (15) years, 36% were females, the mean (SD) eGFR was 32 (10) ml/min/1.73m2 and median (IQR) ACR was 22.7 (110). Biological and analytical variation intrinsic to the eGFR and ACR may lead to a substantial degree of variability that decreases with repeat measures. Use of a web application may help physicians and patients understand individual patient's risk variability and communicate risk (https://mccudden.shinyapps.io/kfre_app/). The web application allows the user to alter age, gender, eGFR, ACR, CV (for both eGFR and ACR) as well as units of measurements for ACR (g/mol versus mg/g).
Conflict of interest statement
The authors have declared that no competing interests exist.
Figures
References
-
- Hill NR, Fatoba ST, Oke JL, Hirst JA, O'Callaghan CA, Lasserson DS, et al. Global Prevalence of Chronic Kidney Disease—A Systematic Review and Meta-Analysis. PLoS One. 2016;11(7):e0158765 doi: 10.1371/journal.pone.0158765 ; PubMed Central PMCID: PMC4934905. - DOI - PMC - PubMed
-
- Wavamunno MD, Harris DC. The need for early nephrology referral. Kidney international Supplement. 2005;(94):S128–32. doi: 10.1111/j.1523-1755.2005.09429.x . - DOI - PubMed
-
- Go AS, Chertow GM, Fan D, McCulloch CE, Hsu CY. Chronic kidney disease and the risks of death, cardiovascular events, and hospitalization. The New England journal of medicine. 2004;351(13):1296–305. doi: 10.1056/NEJMoa041031 . - DOI - PubMed
-
- Tangri N, Inker L, Levey AS. A systematic review finds prediction models for chronic kidney disease were poorly reported and often developed using inappropriate methods. J Clin Epidemiol. 2013;66(6):697 doi: 10.1016/j.jclinepi.2012.11.012 . - DOI - PubMed
-
- Tangri N. A Predictive Model for Progression of Chronic Kidney Disease to Kidney Failure. JAMA. 2011;305:1553 doi: 10.1001/jama.2011.451 - DOI - PubMed
Publication types
MeSH terms
Substances
LinkOut - more resources
Full Text Sources
Other Literature Sources
Medical
Research Materials
Miscellaneous
