. 2018 Dec;74(4):1341-1350.
doi: 10.1111/biom.12920. Epub 2018 Jun 12.

Identifying disease-associated copy number variations by a doubly penalized regression model

Affiliations

Identifying disease-associated copy number variations by a doubly penalized regression model

Yichen Cheng et al. Biometrics. 2018 Dec.

Abstract

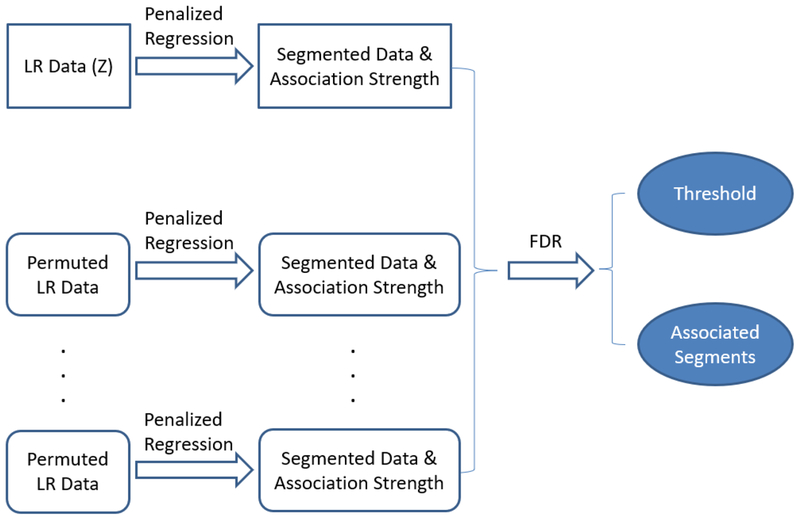
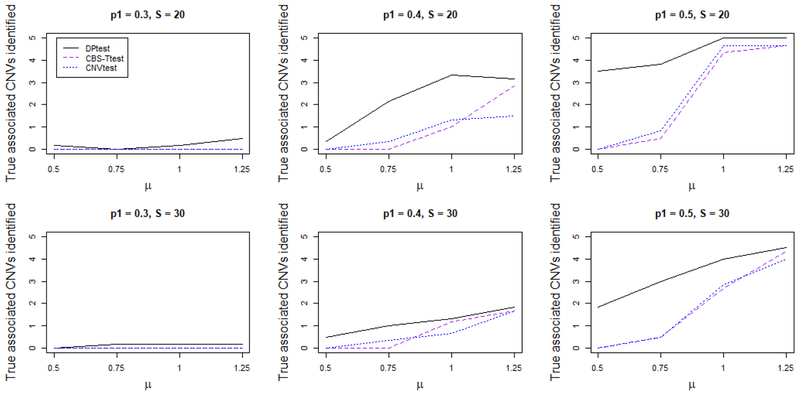
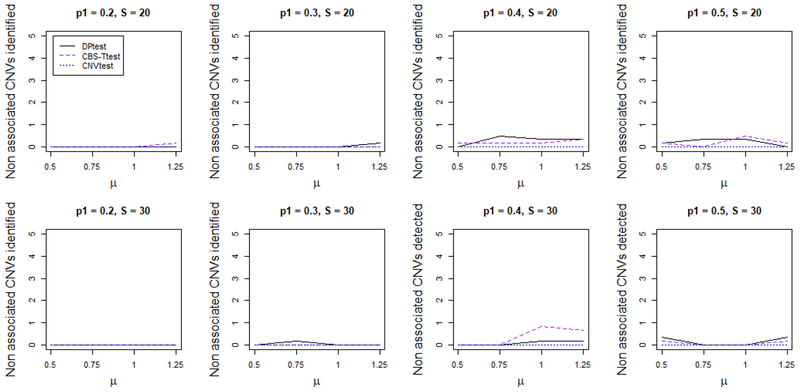
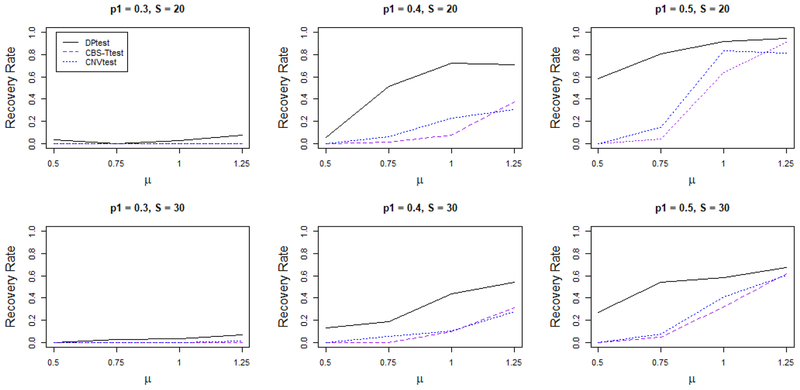
Copy number variation (CNV) of DNA plays an important role in the development of many diseases. However, due to the irregularity and sparsity of the CNVs, studying the association between CNVs and a disease outcome or a trait can be challenging. Up to now, not many methods have been proposed in the literature for this problem. Most of the current researchers reply on an ad hoc two-stage procedure by first identifying CNVs in each individual genome and then performing an association test using these identified CNVs. This potentially leads to information loss and as a result a lower power to identify disease associated CNVs. In this article, we describe a new method that combines the two steps into a single coherent model to identify the common CNV across patients that are associated with certain diseases. We use a double penalty model to capture CNVs' association with both the intensities and the disease trait. We validate its performance in simulated datasets and a data example on platinum resistance and CNV in ovarian cancer genome.

Keywords: Association study; Copy number variation; Ovarian cancer; Penalized regression model.


Figures

Figure 1.
Figure 1.
Diagram for the process to identify the disease associated CNVs.
Figure 2.
Figure 2.
Averaged number of true disease associated CNVs identified by each method. For the top row the CNV occurs at the same genomic location for all subjects carrying the CNV, which has length 20 (S = 20). For the bottom row the CNV occurs at slightly shifted genomic locations for each subject carrying the CNV, which has length 30 (S = 30). DPtest performs the best among all competitors, especially when the LR (μ) of the CNVs is small. This figure appears in color in the electronic version of this article.
Figure 3.
Figure 3.
Average number of false disease associated CNV regions identified by each method. For the top row the CNV occurs at the same genomic location for all subjects carrying the CNV, which has length 20 (S = 20). For the bottom row the CNV occurs at slightly shifted genomic locations for each subject carrying the CNV, which has length 30 (S = 30). Overall, the number of false discoveries is low for DPtest and CNVtest, but the number of false discoveries for CBS-Ttest is higher. This figure appears in color in the electronic version of this article.
Figure 4.
Figure 4.
Average percentage of markes within true disease associated CNVs identified by each method. For the top row the CNV occurs at the same genomic location for all subjects carrying the CNV, which has length 20 (S = 20). For the bottom row the CNV occurs at slightly shifted genomic locations for each subject carrying the CNV, which has length 30 (S = 30). DPtest performs the best among all competitors, especially then the LR μ of the CNVs is small. When the averaged true LR of the CNVs (μ) is high, DPtest, CNVtest and CBS-Ttest perform equally well: they are all able to capture a large fraction of the true CNV. However, when the μ value is low, DPtest is still able to capture a big portion of the true CNV regions while the other methods do not perform as well. This figure appears in color in the electronic version of this article.
Figure 5.
Figure 5.
The estimated η values using the WES data and the SNP data. The dashed and solid line are the cutoff values for controlling the false discovery rate at 10% and 20%, respectively. Multiple locations of CNVs are identified to be associated with the platinum resistant status, with more locations being identified using the SNP data. For example, the regions at 4q22, 6q26, and 15q26 are significant at a false discovery level of 20% for both WES and SNP data. This figure appears in color in the electronic version of this article.

Similar articles

Cited by

References

    1. Alvarez AA, Lambers AR, Lancaster JM, Maxwell GL, Ali S, Gumbs C, et al. (2001). Allele Loss on Chromosome 1p36 in Epithelial Ovarian Cancers. Gynecologic Oncology 82, 94–98. - PubMed
    1. Babur O, Gonen M, Aksoy BA, Schultz N, Ciriello C Sander G, and Demir E (2015). Systematic identification of cancer driving signaling pathways based on mutual exclusivity of genomic alterations. Genome Biology 16, 45. - PMC - PubMed
    1. Barnes C, Plagnol V, Fitzgerald T, Redon R, Marchini J, Clayton D, and Hurles ME (2008). A robust statistical method for case-control association testing with copy number variation. Nature Genetics 40, 1245–1252. - PMC - PubMed
    1. Bast RC Jr. (2011). Molecular approaches to personalizing management of ovarian cancer. Annals of Oncology 22, viii5–viii15. - PMC - PubMed
    1. Benjamini Y, and Hochberg Y (1995). Controlling the false discovery rate: a practical and powerful approach to multiple testing. Journal of the Royal Statistical Society: Series B 57 289–300.