. 2018 Jul 11;18(7):4309-4321.
doi: 10.1021/acs.nanolett.8b01283. Epub 2018 Jun 20.

Structure and Composition Define Immunorecognition of Nucleic Acid Nanoparticles

Affiliations

Structure and Composition Define Immunorecognition of Nucleic Acid Nanoparticles

Enping Hong et al. Nano Lett. .

Abstract

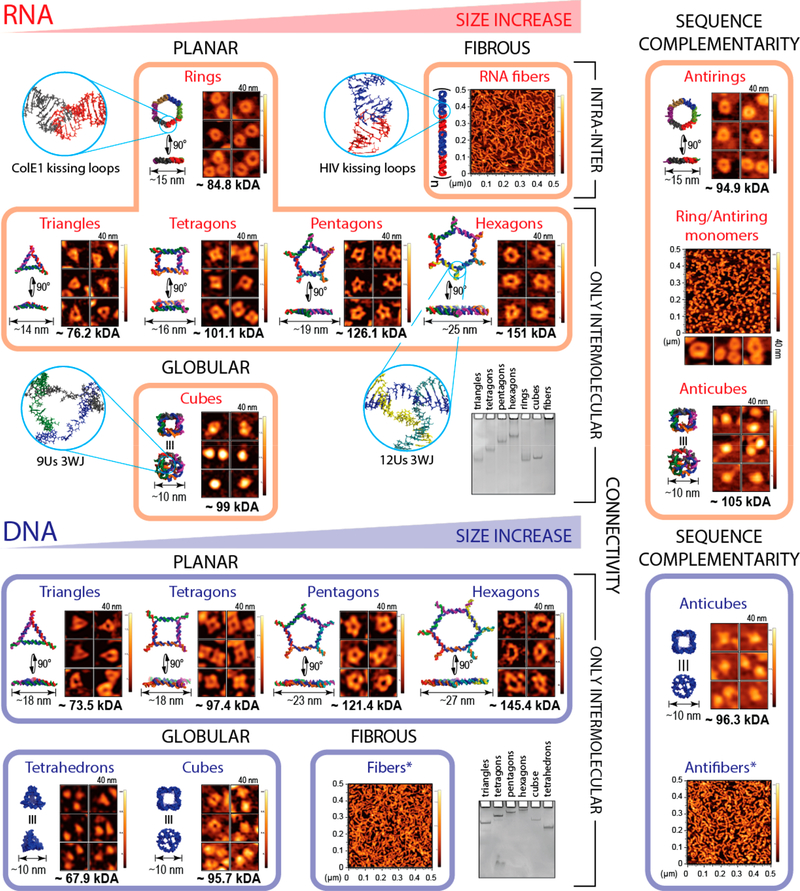
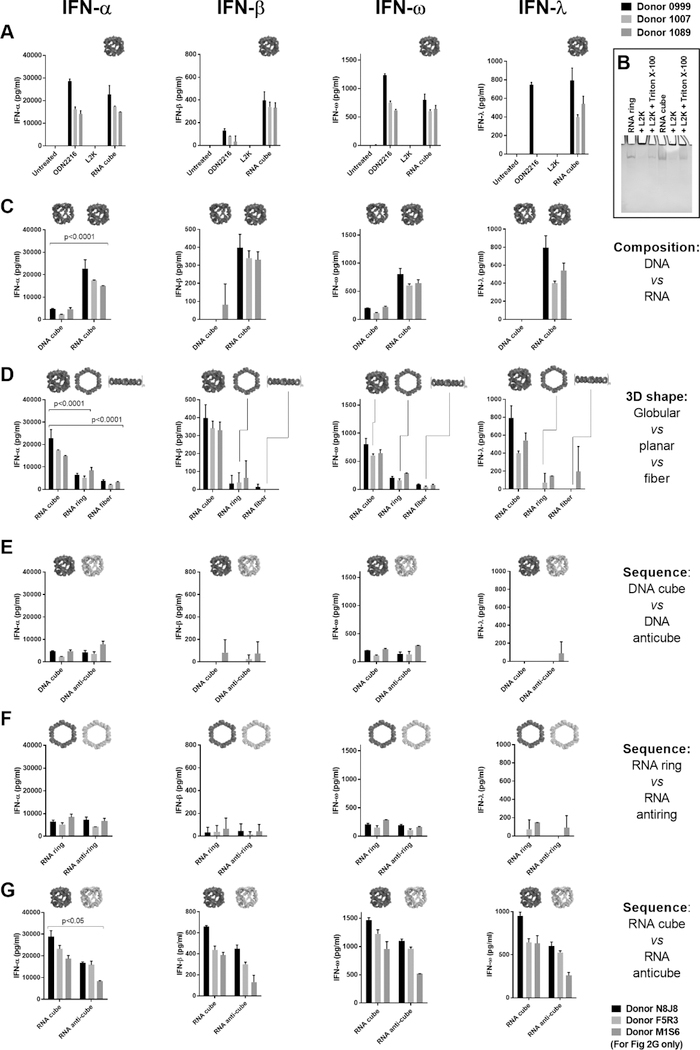
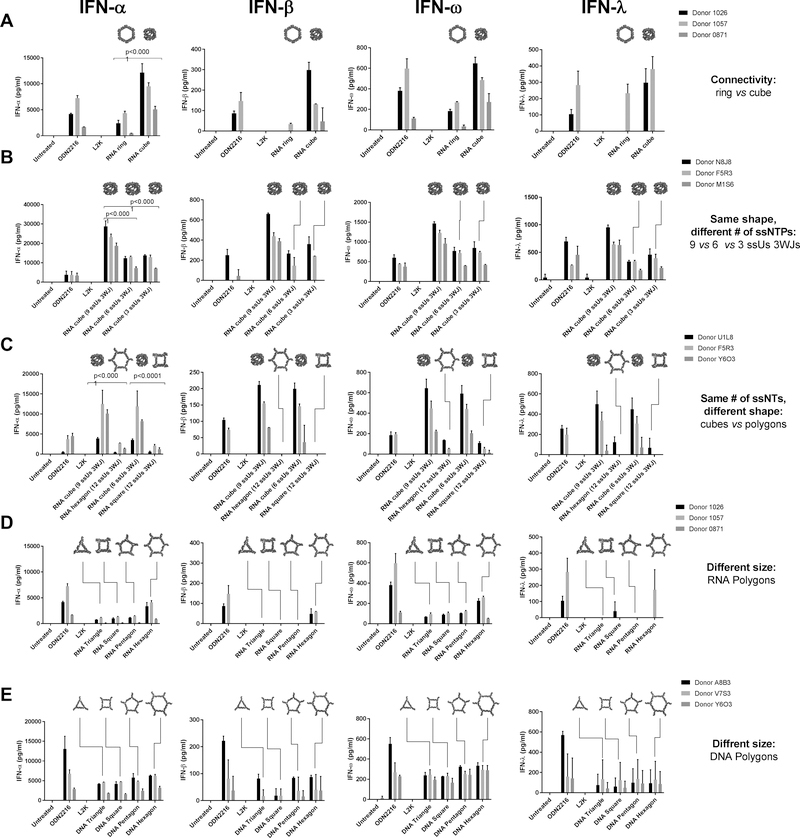
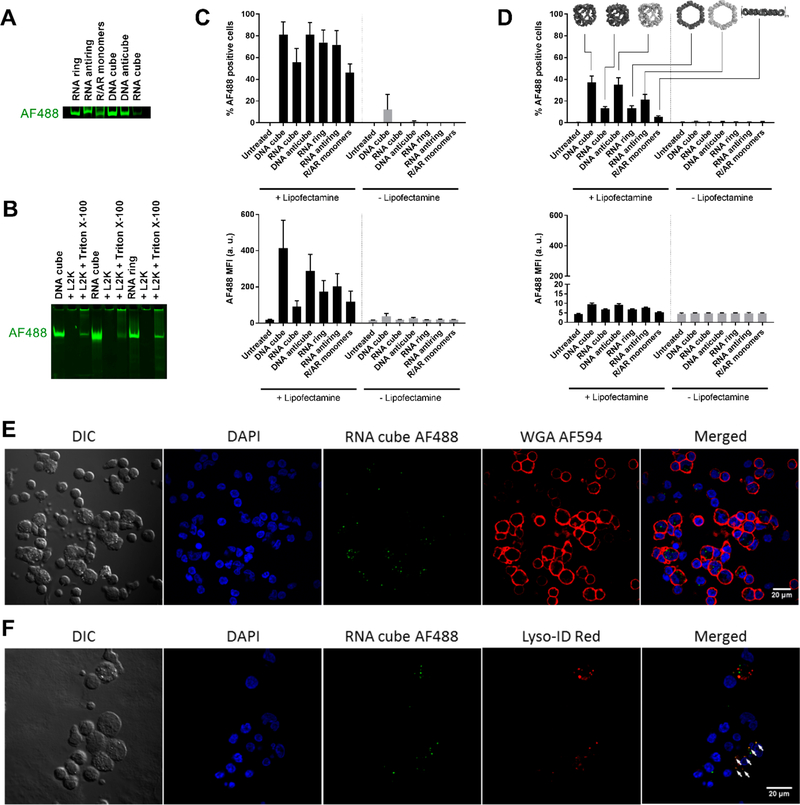
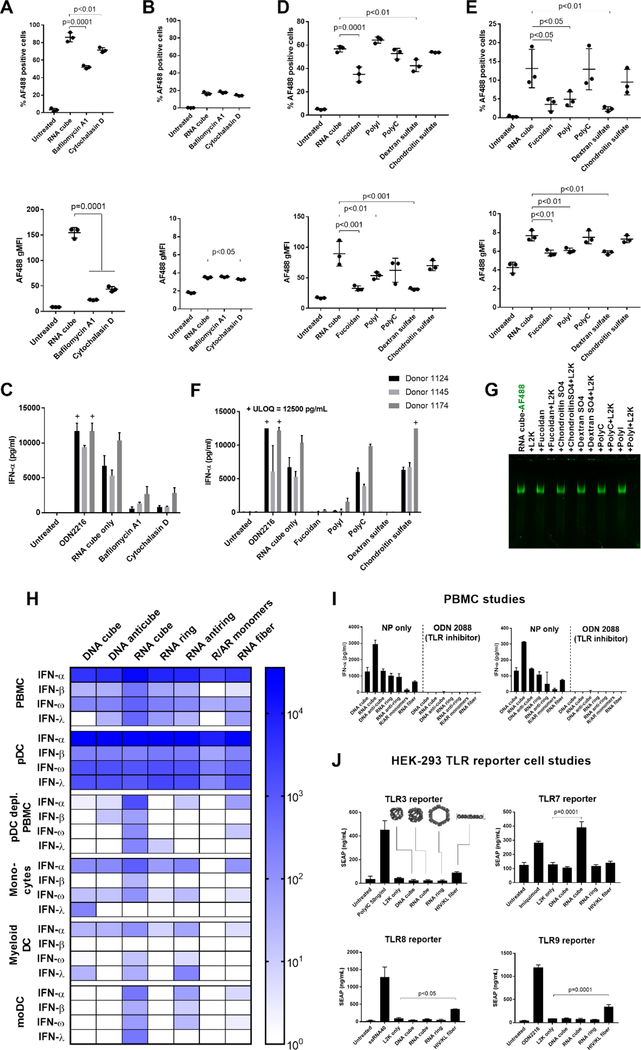
Nucleic acid nanoparticles (NANPs) have evolved as a new class of therapeutics with the potential to detect and treat diseases. Despite tremendous advancements in NANP development, their immunotoxicity, one of the major impediments in clinical translation of traditional therapeutic nucleic acids (TNAs), has never been fully characterized. Here, we describe the first systematically studied immunological recognition of 25 representative RNA and DNA NANPs selected to have different design principles and physicochemical properties. We discover that, unlike traditional TNAs, NANPs used without a delivery carrier are immunoquiescent. We show that interferons (IFNs) are the key cytokines triggered by NANPs after their internalization by phagocytic cells, which agrees with predictions based on the experiences with TNAs. However, in addition to type I IFNs, type III IFNs also serve as reliable biomarkers of NANPs, which is usually not characteristic of TNAs. We show that overall immunostimulation relies on NANP shapes, connectivities, and compositions. We demonstrate that, like with traditional TNAs, plasmacytoid dendritic cells serve as the primary interferon producers among all peripheral blood mononuclear cells treated with NANPs, and scavenger receptor-mediated uptake and endosomal Toll-like receptor signaling are essential for NANP immunorecognition. The TLR involvement, however, is different from that expected for traditional TNA recognition. Based on these results, we suggest that NANP technology may serve as a prototype of auxiliary molecular language for communication with the immune system and the modulation of immune responses.

Keywords: RNA and DNA nanoparticles; TLR; human PBMC; immunorecognition; interferons; pDC.


Conflict of interest statement

The authors declare no competing financial interest.

Figures

Figure 1.
Figure 1.
NANPs used in this study. Representative NANPs organized to emphasize their differences in size, shape, composition, connectivity, and sequence complementarity: the key parameters contributing to the immunological recognition of NANPs. Energy-minimized 3D models of NANPs with corresponding atomic force microscopy images, relative electrophoretic mobility, estimated sizes, and molecular weights are included. The asterisk indicates that DNA fibers contain ssRNA components in their structure.
Figure 2.
Figure 2.
Complexation with lipofectamine, material type, and 3D structure are critical for the NANP induction of interferon responses. Graphs show the production of IFNs by PBMCs after the delivery of NANPs with Lipofectamine 2000 (L2K). (A) Delivery of RNA cubes stimulates the production of all IFNs assayed. ODN 2216 is a positive control. (B) Ethidium bromide total staining native polyacrylamide gel electrophoresis (PAGE) results demonstrate complexation and retention of NANPs’ structural integrity upon interaction with L2K; NANPs’ complexation with L2K prevents them from entering the gel, while detergent treatment releases NANPs and restores their electrophoretic mobility. (C) RNA cubes induce greater IFN production by PBMCs than DNA cubes. (D) Comparison of RNA cubes, rings, and fibers shows that cubes are the most immunostimulatory. (E–G) Reversing the nucleic acid sequences for (E) DNA cubes and (F) RNA rings does not affect IFN induction. However, RNA cubes are stronger inducers of IFN than (G) anti-cubes. Corresponding 3D models of NANPs are shown in-line with IFN data. Each bar represents data from a single donor, showing a mean response and standard deviation (n = 3 donors). For panels A–F, donor numbers are 0999, 1007, and 1089; for panel G, donor numbers are N8J8, F5R3, and M1S6. Statistical analysis was performed by one-way ANOVA. The differences are significant for all INF in panels C, D, and G with the same p values as for INFα.
Figure 3.
Figure 3.
NANPs’ connectivity and size contribute to interferon induction in PBMCs. Bar graphs show the production of IFNs by PBMCs after the delivery of NANPs with L2K. (A) Comparison of NANPs with similar size but different connectivity. IFN stimulation by RNA cubes is stronger than that by RNA rings. (B) Comparison of NANPs with similar shape but different ssNTs. (C) Comparison of NANPs with the same number of ssNTs but different shape. When the number of ssUs is kept constant, 3D globular RNA NANPs (cubes) are more immunostimulatory than planar NANPs (polygons). (D) IFN induction by RNA polygons of different sizes. (E) IFN induction by DNA polygons of different sizes. Each bar shows a mean response and standard deviation from experimental duplicates (n = 3 donors). Schematics explaining connectivity can be viewed in Supplemental Figure S1. Statistical analysis was performed by one-way ANOVA. The differences are significant for all INF in panels A, B, and C with the same p values as for INFα.
Figure 4.
Figure 4.
Internalization of NANPs by PBMCs occuring through the endolysosomal pathway. All tested NANPs were assembled with AF488-labeled strands. (A) Fluorescence imaging of AF488-labeled NANPs analyzed by native PAGE. Due to variations in the labeling efficiencies of purchased monomers, various NANPs have different amounts of AF488 in their structures. (B) Labeled NANPs form complexes with L2K and retain their structural integrity upon detergent-mediated release. (C, D) AF488-labeled NANPs with L2K were delivered to PBMCs, which were then studied using flow cytometry. Each bar shows the mean response derived from three individual donors and a standard deviation. Samples in each individual donor were analyzed in duplicate. (C) Monocytes and (D) lymphocytes were assessed for both the percentage of cells that took up NANPs (upper plots) and the number of NANPs taken up as represented by geometric mean fluorescence intensity (MFI) (lower plots). NANP fluorescence was greatly associated with monocytes but minimally associated with lymphocytes. (E, F) PBMCs treated with AF488-labeled RNA cubes were visualized with confocal microscopy. (E) Intracellular localization of RNA cubes (green) was demonstrated using Alexa Fluor 594-labeled wheat germ agglutinin (WGA 594) to delineate cell membranes (red). (F) RNA cubes (green) were also shown to localize with the endolysosomal pathway (white arrows) using Lyso-ID Red as a stain for acidic vesicles (red). Shown is the representative image of several fields of view with a total count of at least 100 cells.
Figure 5.
Figure 5.
Cellular and molecular mechanisms involved in the immune recognition of NANPs. The study involved 12 donors in total. After pretreatment with the inhibitors bafilomycin A1 and cytochalasin D, (A) monocytes and (B) lymphocytes were analyzed by flow cytometry for the percentage of cells that took up AF488-labeled RNA cubes (upper plots) and the number of particles taken up as represented by MFI (lower plots). A total of three donors (1083, 1094, and 1150) were tested, with each dot representing data from an individual donor. Phagocytosis and endosomal acidification are essential for NANP internalization by monocytes. (C) PBMCs from three donors treated with bafilomycin A1 and cytochalasin D did not produce an IFN-α response when exposed to unlabeled RNA cubes. (D, E) PBMCs were pretreated with several scavenger receptor inhibitors [fucoidan, polyinosinic acid (polyI), and dextran sulfate] and controls [polycytidylic acid (polyC) and chondroitin sulfate] before being exposed to AF488-labeled RNA cubes. (D) Monocytes and (E) lymphocytes were analyzed by flow cytometry. Fucoidan and dextran sulfate blocked the uptake of RNA cubes in monocytes (D), whereas fucoidan, polyI, and dextran sulfate blocked uptake in lymphocytes (E). A total of three donors (0794, 1155, and 1157) were tested, with each dot representing data from an individual donor. (F) PBMCs were treated with scavenger receptor inhibitors and then treated with unlabeled RNA cubes and assayed for IFN-α production. (G) Native PAGE showing that none of the inhibitors induced release of L2K complexation with AF488-labeled RNA cubes. “+ ULOQ” refers to the IFN levels above the assay’s upper limit of quantification. Statistical analysis was performed by one-way ANOVA with Dunnett’s post-test, comparing all groups to the RNA cube alone (single asterisk, p < 0.05; double asterisks, p < 0.01; triple asterisks, p < 0.001; quadruple asterisks, p = 0.0001). (H–J) Cells from major DC subsets [plasmacytoid DCs (pDCs), monocytes, and myeloid DCs] were purified from whole blood by negative selection, treated with NANPs, and assayed for IFN production (H). Each box represents an averaged value across separate groups of three donors. Plasmacytoid DCs were depleted from PBMCs (pDC-depleted PBMC) by positive selection, and the resulting cells were treated with NANPs. Purified monocytes were differentiated into monocyte-derived DCs, treated with NANPs, and tested for IFN induction. Complete data sets are presented in Figure S16. (I) NANPs were complexed with L2K and added to PBMCs either alone or with a pan-TLR inhibitor, ODN 2088. Production of IFN-α (left) and IFN-ω (right) was measured by multiplexed ELISA. (J) HEK-293 reporter cell lines overexpressing TLR3, TLR7, TLR8, or TLR9 were used to estimate the recognition of NANPs. Known agonists to the respective TLRs were used as positive controls: poly(I:C) for TLR3, Imiquimod for TLR7, ssRNA40 for TLR8, and ODN 2216 for TLR9. Only RNA cubes activated the SEAP reporter gene in the TLR7-over-expressing cell line. Activation of the reporter gene by RNA fibers was observed in TLR3-, TLR8-, and TLR9-over-expressing cells (possibly due to the expression of endogenous TLR3 in all cell lines). Each bar in panels H–J shows a mean response and a standard deviation (n = 3). Statistical analysis was performed by one-way ANOVA with Dunnett’s post-test, comparing all groups to the “L2K only” results.

Similar articles

Cited by

References

    1. Grijalvo S; Alagia A; Jorge AF; Eritja R Genes 2018, 9, (2).74 - PMC - PubMed
    1. Sasaki S; Guo S Nucleic Acid Ther. 2018, 28 (1), 1–9. - PubMed
    1. Nimjee SM; White RR; Becker RC; Sullenger BA Annu. Rev. Pharmacol. Toxicol 2017, 57, 61–79. - PMC - PubMed
    1. Kaczmarek JC; Kowalski PS; Anderson DG Genome Med. 2017, 9 (1), 60. - PMC - PubMed
    1. Lieberman J Nat. Struct. Mol. Biol 2018, 25 (5), 357–364. - PMC - PubMed

Publication types

MeSH terms