. 2018 Jun 11;33(6):1004-1016.e5.
doi: 10.1016/j.ccell.2018.05.006.

BAI1 Suppresses Medulloblastoma Formation by Protecting p53 from Mdm2-Mediated Degradation

Affiliations

BAI1 Suppresses Medulloblastoma Formation by Protecting p53 from Mdm2-Mediated Degradation

Dan Zhu et al. Cancer Cell. .

Abstract

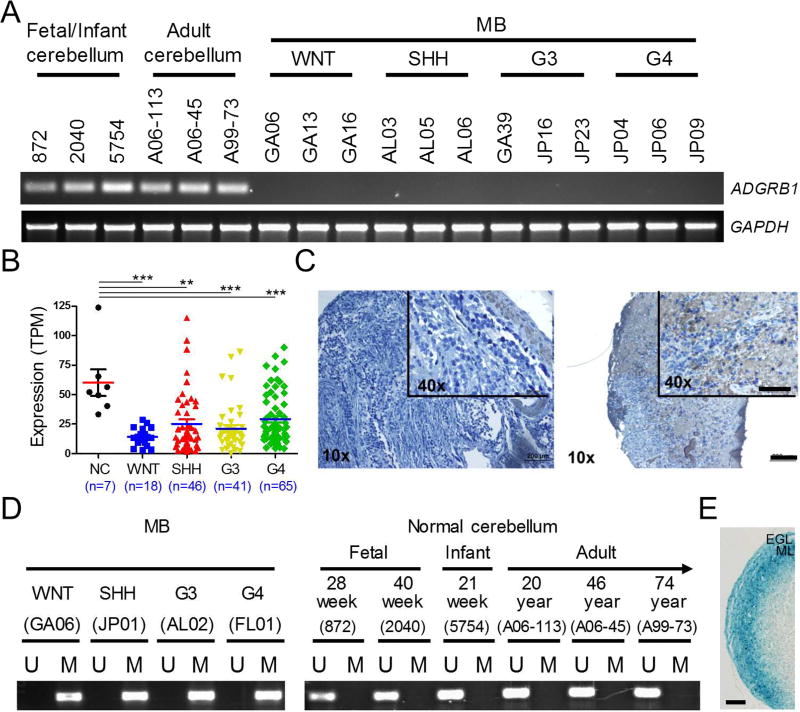
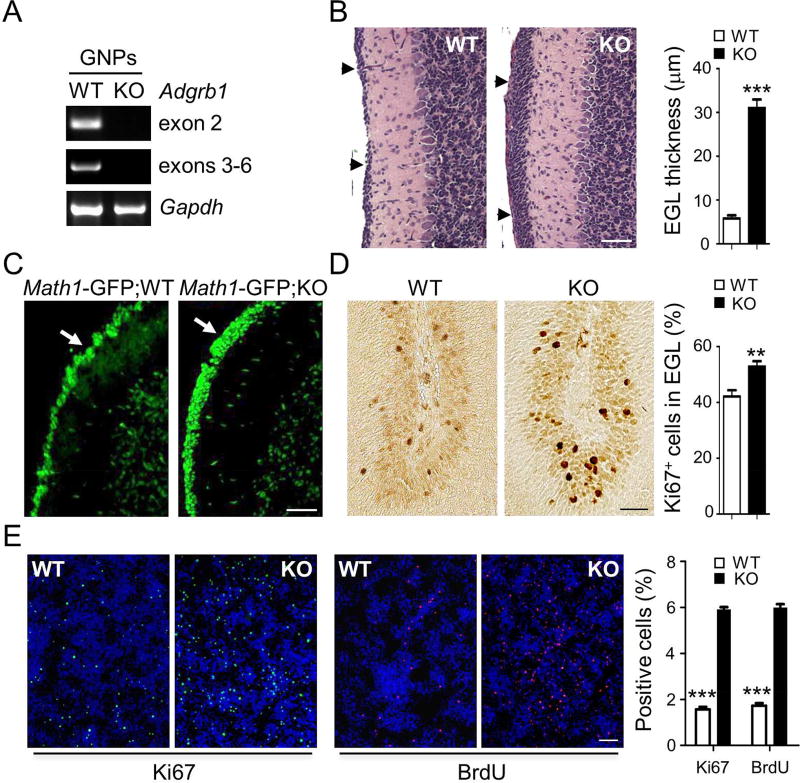
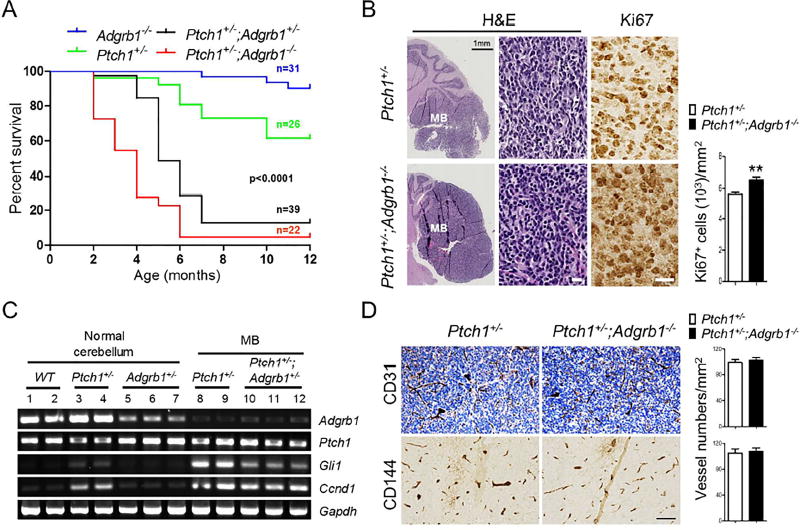
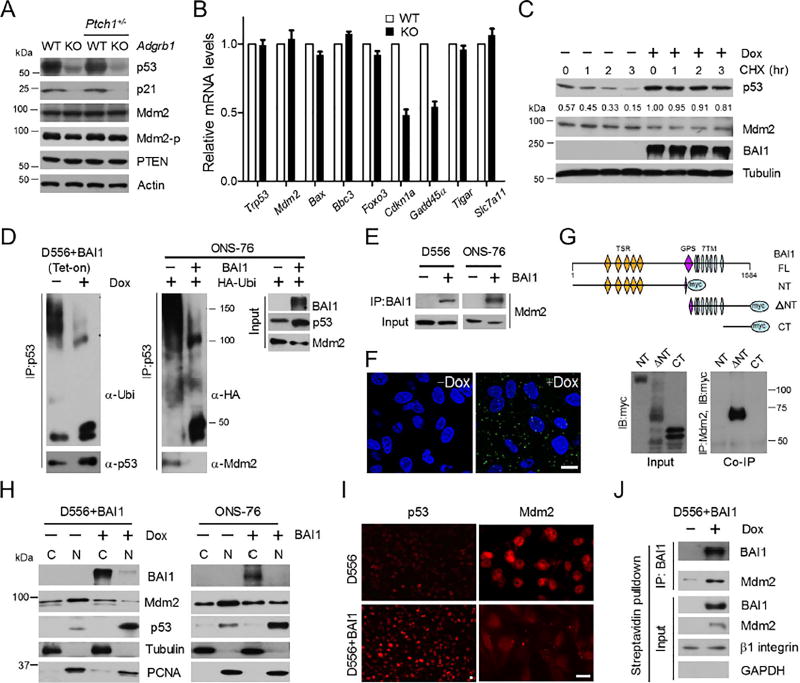
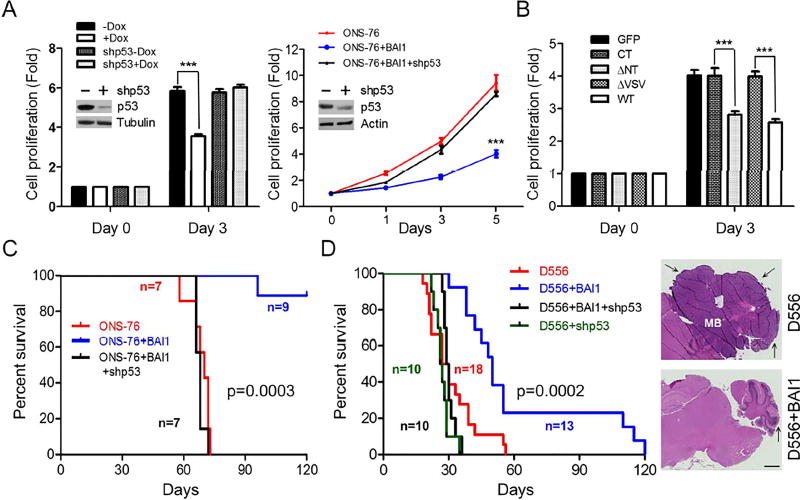
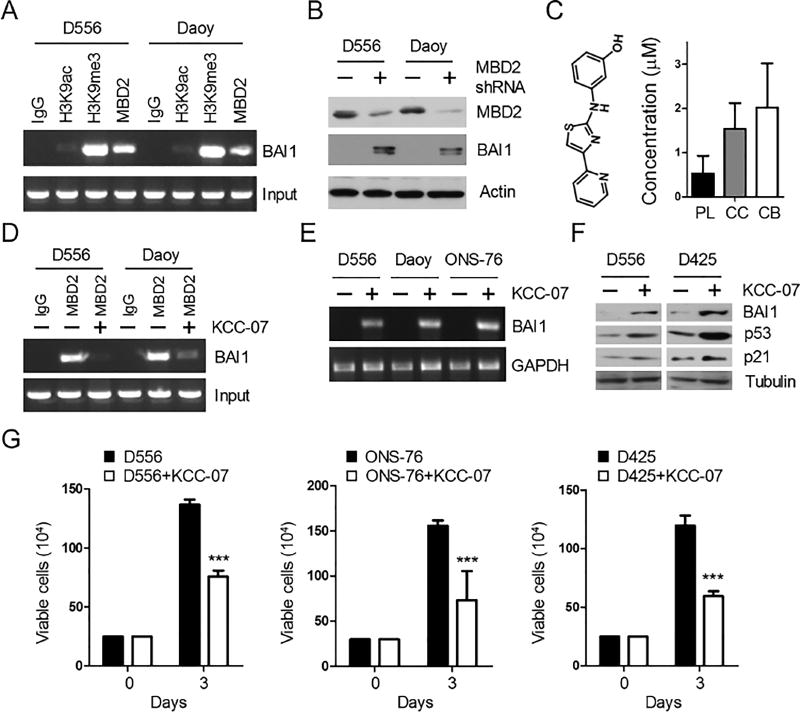
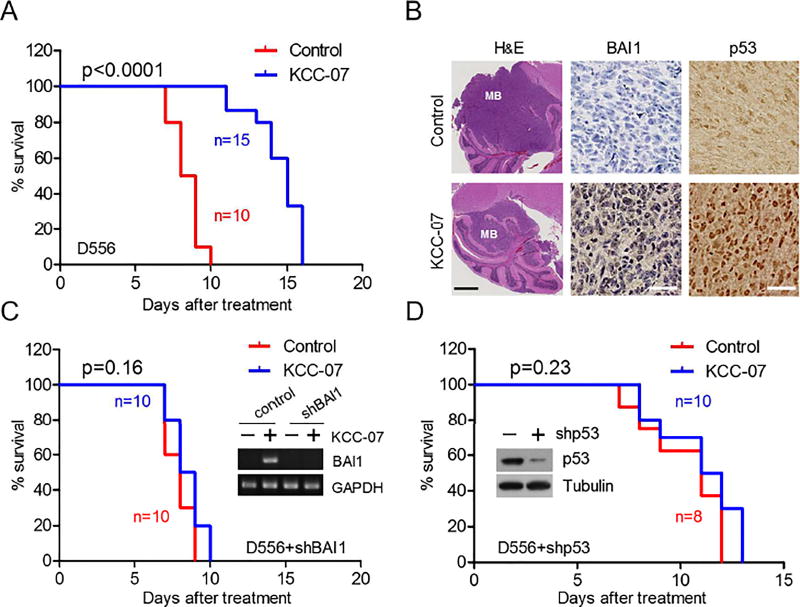
Adhesion G protein-coupled receptors (ADGRs) encompass 33 human transmembrane proteins with long N termini involved in cell-cell and cell-matrix interactions. We show the ADGRB1 gene, which encodes Brain-specific angiogenesis inhibitor 1 (BAI1), is epigenetically silenced in medulloblastomas (MBs) through a methyl-CpG binding protein MBD2-dependent mechanism. Knockout of Adgrb1 in mice augments proliferation of cerebellar granule neuron precursors, and leads to accelerated tumor growth in the Ptch1+/- transgenic MB mouse model. BAI1 prevents Mdm2-mediated p53 polyubiquitination, and its loss substantially reduces p53 levels. Reactivation of BAI1/p53 signaling axis by a brain-permeable MBD2 pathway inhibitor suppresses MB growth in vivo. Altogether, our data define BAI1's physiological role in tumorigenesis and directly couple an ADGR to cancer formation.

Keywords: ADGRB1; BAI1; GPCR; MBD2; Mdm2; brain tumor; epigenetic silencing; medulloblastoma; p53.


Conflict of interest statement

DECLARATION OF INTERESTS

The authors have no competing financial interests.

Figures

Figure 1
Figure 1. Epigenetic Silencing of ADGRB1/BAI1 Expression in MB
(A) RT-PCR analysis of ADGRB1 mRNA expression in patient MB tumors and normal human fetal, infant and adult cerebellum. GAPDH was used as a control. (B) Analysis of ADGRB1 mRNA levels in 7 normal cerebella (NC) and 170 MB samples by RNA-Seq (Northcott et al., 2017). TPM, Transcripts Per Kilobase Million. Individual data points with the mean ± SEM are shown. *** p<0.0001, ** p<0.01, t test. (C) IHC staining of BAI1 in a de-identified, formalin-fixed, paraffin-embedded tissue array containing 60 MBs shows low (51 cases; score 0–4) or moderate (9 cases; score 6–9) BAI1 expression. Scale bar, 200 µm. For inset, scale bar, 100 µm. (D) MS-PCR analysis of DNA methylation in the CpG island of the ADGRB1 promoter. Representative results (n=3) of 1 sample from each MB group and 6 normal cerebella are shown. (E) β-Gal staining for Adgrb1 promoter activity in Adgrb1-LacZ reporter mice at postnatal day 10 (P10). ML, molecular layer. Scale bar, 100 µm. See also Figures S1, S2 and Table S1.
Figure 2
Figure 2. Adgrb1 Loss Enhances GNP proliferation
(A) RT-PCR analysis of Adgrb1 mRNA expression in GNPs isolated from WT and Adgrb1−/− mice at postnatal day 5 (P5). Primers in two different gene locations were tested (exons 2 and 3–6). (B) H&E staining shows the EGL at postnatal day 14 (P14) in WT and Adgrb1−/− mice (KO) cerebellum (arrows). Scale bar, 50 µm. Right, quantification of EGL thickness. ***, p<0.0001, 2-tailed Student’s t-test, n=15. (C) Fluorescence microscopy of mouse cerebella at P14 shows GFP-positive cells (arrows) in the EGL of Math1-GFP;KO (Adgrb1−/−) mice versus control Math1-GFP;WT (Adgrb1+/+) mice. Scale bar, 50 µm. (D) IHC and quantification of Ki67 positive cells in EGL at postnatal day 7. **, p<0.001, 2-way ANOVA test, n=8. Scale bar, 30 µm. (E) In vitro proliferation of primary GNP cultures isolated from P5 WT and Adgrb1−/− (KO) mice. Cycling cells were either stained for Ki67 (green fluorescence) or labeled with BrdU and visualized through the red fluorescence signal. Hoechst 33342 counterstaining (blue) reveals the nuclei. Scale bar, 200 µm. Histograms show quantification of BrdU and Ki67 positive cells, ***, p<0.0001, 2-way ANOVA test, n=5. All histogram data represent mean ± SEM.
Figure 3
Figure 3. Adgrb1 Loss Increases Penetrance and Accelerates Tumor Growth in the Ptch1+/− SHH-MB Mouse Model
(A) Kaplan-Meier curves show the survival of Ptch1+/− mice in the presence of hemi- or homozygous deletion of Adgrb1 (p<0.0001; log-rank test). (B) H&E staining of 5-month-old Ptch1+/− and Ptch1+/−;Adgrb1−/− mouse cerebella with tumor. IHC shows Ki67 staining in tumor cells and quantification is shown by histogram, p=0.005, t test, n=6. Scale bar, 30 µm. (C) RT-PCR analysis of mRNA expression of Adgrb1, Ptch1 and SHH pathway markers (Gli1 and Ccnd1) in adult normal cerebellum and MB from mice with indicated genotypes. (D) Representative images show IHC staining for endothelial cell markers CD31 (top) and CD144 (VE-cadherin, bottom) in 5-month-old mice MB. Scale bar, 100 µm. All histogram data represent mean ± SEM. See also Figure S3.
Figure 4
Figure 4. BAI1 blocks Mdm2-mediated p53 Polyubiquitination and Degradation
(A) Representative immunoblots (n=3) show indicated protein expression in WT and Adgrb1−/− mouse cerebellum at P14. (B) qRT-PCR analysis of p53 target gene expression in WT and Adgrb1−/− cerebellum at P14. Histogram data represent mean ± SEM. (C) Western blot showing p53 expression in the D556+BAI1 (Tet-on) MB cells +/− doxycycline (Dox) treatment. CHX (50 µg/ml) was used and normalized fraction of remaining p53 levels after 1–3 hr is indicated. (D) Left panel, IP was performed with anti–p53 antibody, and polyubiquitination of p53 was determined by anti-ubiquitin antibody with or without Dox treatment. Right panel, ONS-76 cells were transiently transfected with BAI1 and HA-ubiquitin expression vectors. IP was performed with anti–p53 antibody, followed by IB detection of ubiquitin chains (anti-HA antibody) or Mdm2. (E) IP with BAI1 antibodies in D556 and ONS-76 human MB cells followed by IB of Mdm2. (F) Representative confocal images of PLA in D556-BAI1 tet-on cells (+/− 1 µg/ml Dox, 48 hr). Green spots are regions of signal amplification denoting BAI1-Mdm2 interaction. Nuclear stain (DAPI) is blue. Scale bars, 10 µm. (G) Top, schematic diagram shows myc-tagged BAI1 truncated constructs. NT=N-terminus, ΔNT=N-terminal truncated, CT=C-terminus. Bottom, IP with Mdm2 antibodies in HEK293 cells followed by IB of myc tag. (H) Cell fractionation shows distribution of 90-kDa Mdm2 and p53 in D556+BAI1 (tet-on) cells and transiently transfected ONS-76 cells. Cytoplasmic (C) and nuclear (N) fractions are shown. All blots show representative images from 3 independent experiments with similar results. (I) Analysis of p53 and Mdm2 nuclear localization by immunofluorescence upon BAI1 induction in D556+BAI1 (tet-on) cells. Scale bar, 10 µm. (J) D556+BAI1 (tet-on) cell surface proteins were biotinylated and collected by streptavidin-bead pulled-down. IP was then performed with BAI1 antibodies on purified cell surface proteins followed by IB of Mdm2. See also Figure S4.
Figure 5
Figure 5. BAI1 inhibits MB Growth in vitro and in vivo in a p53-dependent manner
(A) Left, cell proliferation of D556+BAI1 (tet-on) cells with stable p53 knockdown upon BAI1 induction. Fold is the ratio of live cells on day 3/day 0. Right, cell proliferation of ONS-76 MB cells with stable transfection of BAI1 +/− p53 shRNA lentivirus was measured for 5 days. Efficiency of shRNA-mediated knockdown was evaluated by Western blots (insets). ***, p<0.0001, 2-way ANOVA, n=3. (B) Effect of BAI1 WT and mutants on ONS-76 cell proliferation. Fold is the ratio of live cells on day 3/day 0. ***, p<0.0001, 2-way ANOVA, n=5. (C) Kaplan-Meier curves show the survival of mice with intracranial xenografts of ONS-76 cells infected by lentiviral-expressed BAI1 +/− stable p53 knockdown (p=0.0003; log-rank test). (D) Kaplan-Meier curves show the survival of mice with intracranial xenografts of D556 cells infected by lentiviral-expressed BAI1 +/− stable p53 knockdown (p=0.0002; log-rank test). Right, representative images show H&E staining of MB sections, and arrows show tumor. Scale bar, 1 mm. All histogram data represent mean ± SEM. See also Figure S5.
Figure 6
Figure 6. KCC-07 distributes to the Brain and Inhibits Tumor Growth in vitro
(A) Analysis of histone H3 marks and MBD2 binding on ADGRB1 promoter in human MB cells by ChIP assay. (B) WB analysis of BAI1 protein expression in human MB cells with MBD2-shRNAs. (C) Left panel, structure of MBD2 pathway inhibitor KCC-07. Right, concentration of KCC-07 in the plasma (PL), cerebral cortex (CC) and cerebellum (CB) one hr after i.p. injection (100 mg/kg). (D) ChIP assay shows the effect of KCC-07 treatment (10 µM, 48 hr) on the binding of MBD2 to ADGRB1 promoter in MB cells. (E) RT-PCR analysis of ADGRB1 expression in MB cell lines with KCC-07 treatment. (F) Western blot shows the effect of KCC-07 on BAI1/p53/p21 protein expression in MB cells. All blots show representative images (n=3). (G) Effect of KCC-07 treatment (10 µM, 3 days) on the growth of MB cell lines in vitro. ***, p<0.0001, 2-way ANOVA test, n=3. Histogram data represent mean ± SEM.
Figure 7
Figure 7. KCC-07 Inhibits Orthotopic MB Growth in mice xenografts
(A) Kaplan-Meier survival curves show effect of KCC-07 (100 mg/kg i.p.; 5 days/week) on the survival of mice harboring D556 intracranial xenografts. p<0.0001, log-rank test. (B) Effect of KCC-07 on tumor size (H&E), BAI1 and p53 expression (IHC) in tumors from (A). Scale bar in H&E images, 1 mm. Scale bar in IHC images, 25 µm. (C) Kaplan-Meier survival curves shows effect of KCC-07 on the survival of mice harboring intracranial xenografts of D556 cells with lentiviral shRNA-mediated abrogation of BAI1 (p=0.16, log-rank test). (D) Kaplan-Meier survival curves shows effect of KCC-07 on the survival of mice harboring intracranial xenografts of D556 cells with lentiviral shRNA-mediated abrogation of p53 (p=0.23, log-rank test). See also Figure S6.

Comment in

References

    1. Abe Y, Oda-Sato E, Tobiume K, Kawauchi K, Taya Y, Okamoto K, Oren M, Tanaka N. Hedgehog signaling overrides p53-mediated tumor suppression by activating Mdm2. Proc Natl Acad Sci U S A. 2008;105:4838–4843. - PMC - PubMed
    1. Ballestar E, Wolffe AP. Methyl-CpG-binding proteins. Targeting specific gene repression. Eur J Biochem. 2001;268:1–6. - PubMed
    1. Bigner SH, Friedman HS, Vogelstein B, Oakes WJ, Bigner DD. Amplification of the c-myc gene in human medulloblastoma cell lines and xenografts. Cancer Res. 1990;50:2347–2350. - PubMed
    1. Brennan CW, Verhaak RG, McKenna A, Campos B, Noushmehr H, Salama SR, Zheng S, Chakravarty D, Sanborn JZ, Berman SH, et al. The somatic genomic landscape of glioblastoma. Cell. 2013;155:462–477. - PMC - PubMed
    1. Bridges TM, Lindsley CW. G-protein-coupled receptors: from classical modes of modulation to allosteric mechanisms. ACS Chem Biol. 2008;3:530–541. - PubMed

Publication types

MeSH terms