. 2018 Jun 11;33(6):1033-1047.e5.
doi: 10.1016/j.ccell.2018.05.005.

Selective FcγR Co-engagement on APCs Modulates the Activity of Therapeutic Antibodies Targeting T Cell Antigens

Affiliations

Selective FcγR Co-engagement on APCs Modulates the Activity of Therapeutic Antibodies Targeting T Cell Antigens

Jeremy D Waight et al. Cancer Cell. .

Abstract

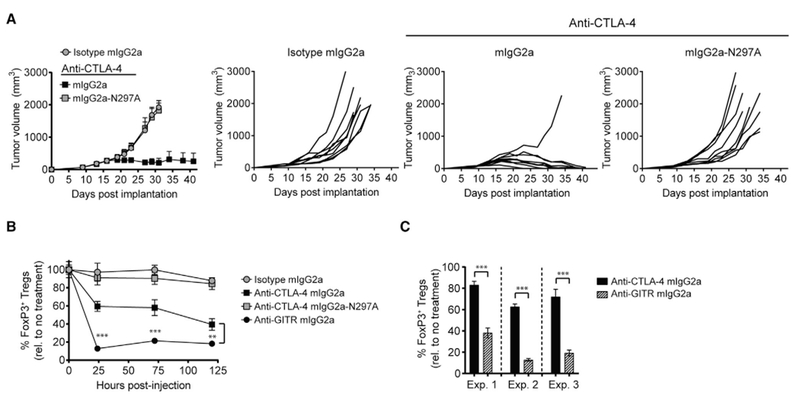
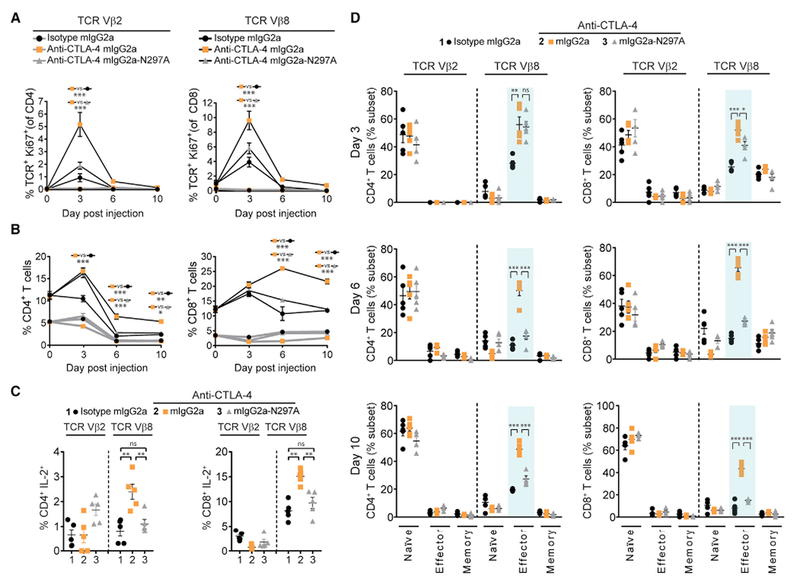
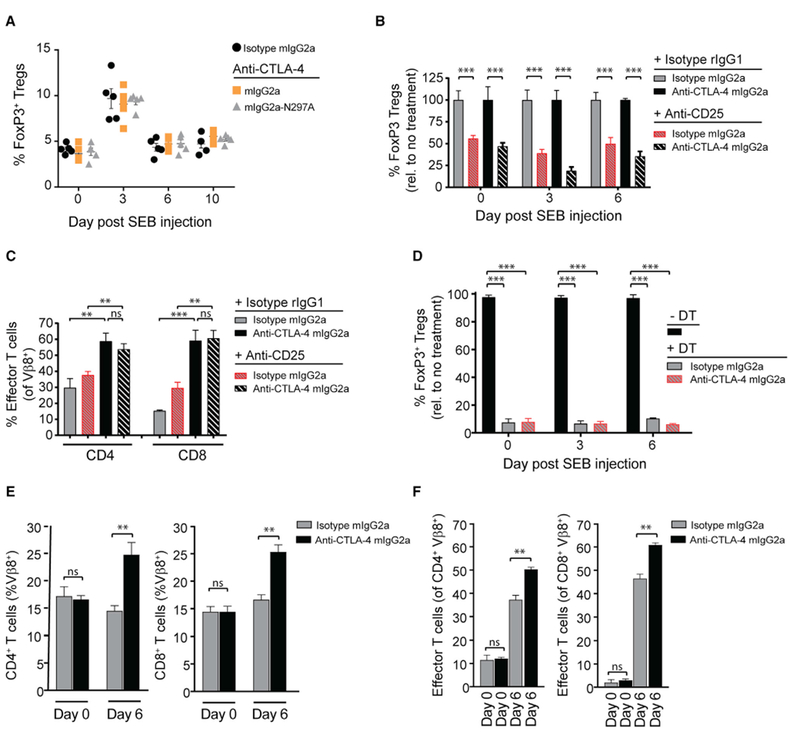
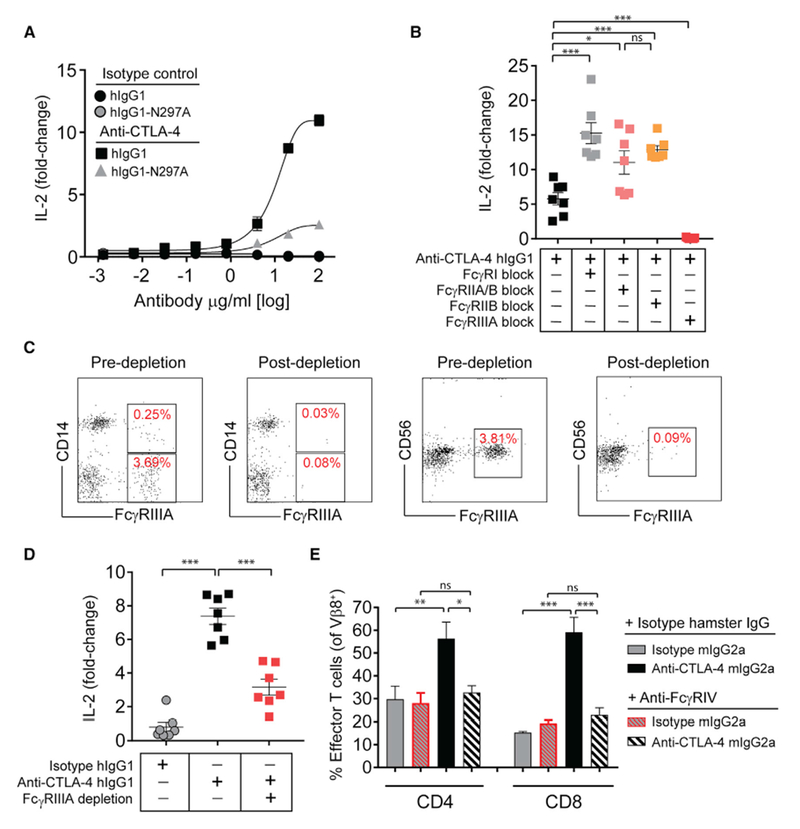
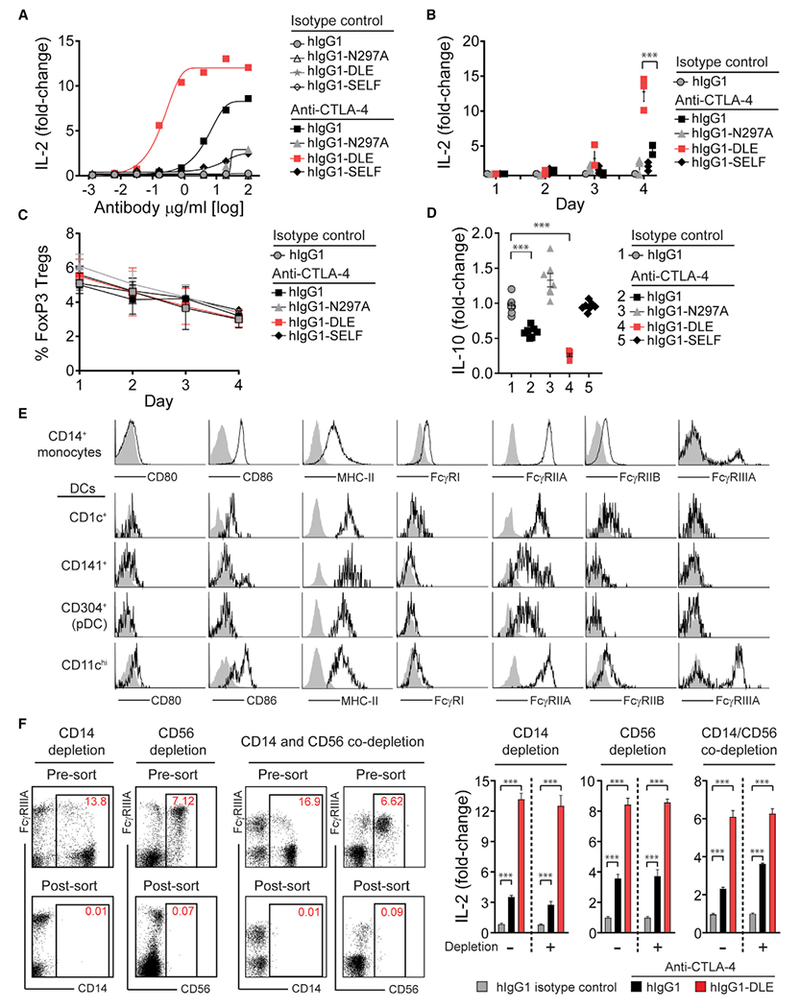
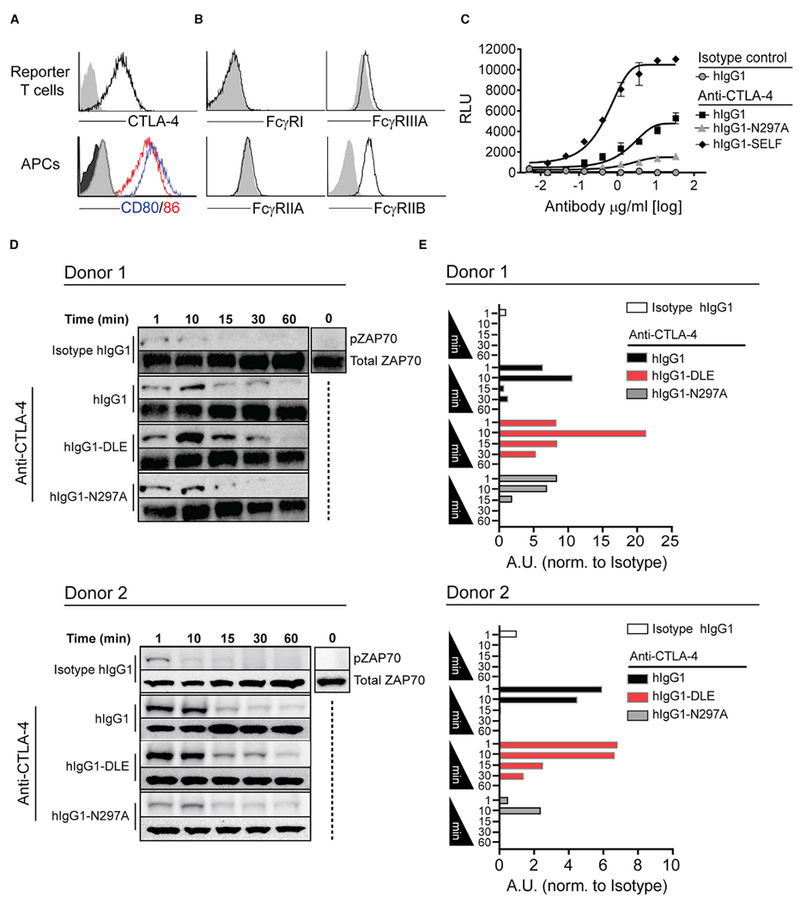
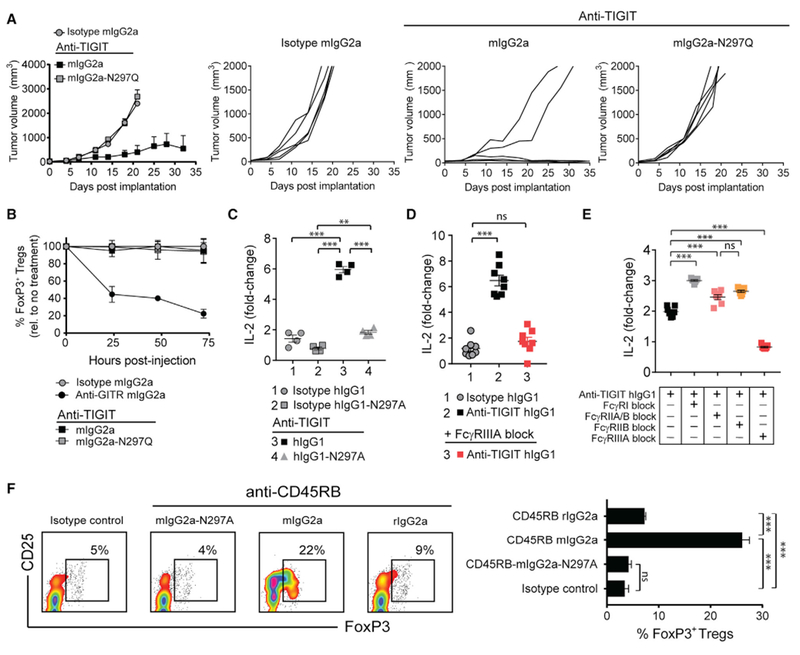
The co-engagement of fragment crystallizable (Fc) gamma receptors (FcγRs) with the Fc region of recombinant immunoglobulin monoclonal antibodies (mAbs) and its contribution to therapeutic activity has been extensively studied. For example, Fc-FcγR interactions have been shown to be important for mAb-directed effector cell activities, as well as mAb-dependent forward signaling into target cells via receptor clustering. Here we identify a function of mAbs targeting T cell-expressed antigens that involves FcγR co-engagement on antigen-presenting cells (APCs). In the case of mAbs targeting CTLA-4 and TIGIT, the interaction with FcγR on APCs enhanced antigen-specific T cell responses and tumoricidal activity. This mechanism extended to an anti-CD45RB mAb, which led to FcγR-dependent regulatory T cell expansion in mice.

Keywords: CD45RB; CTLA-4; Fc engineering; Fcγ receptor; TCR signaling; TIGIT; cancer immunotherapy; effector T cells; immune synapse; regulatory T cells.


Figures

Figure 1.
Figure 1.. Quantitative Differences in Selective Intratumoral Treg Cell Depletion by mAbs Targeting CTLA-4 and GITR
(A) BALB/c mice with established CT26 tumors (50–80 mm3) were treated with a single 100-μg intraperitoneal (i.p.) dose of anti-CTLA-4, or mIgG2a isotype control mAb. Individual tumor growth rates (n = 9 mice/group) are shown on the right. (B) CT26 tumor-bearing (50–80 mm3) mice were treated with a single 100-μg i.p. dose of anti-CTLA-4, anti-GITR mIgG2a, or mIgG2a isotype control mAb. Intratumoral FoxP3+ Treg cell depletion was evaluated by flow cytometry pre- (t = 0 hr) and post-mAb injection (t = 24, 72, and 120 hr) (n = 4 mice/treatment time point). (C) Percent (%) reduction in intratumoral FoxP3+ Treg cells 24 hr post-anti-CTLA-4 mIgG2a (Experiment [Exp.]: 1, 17 ± 3; 2, 35 ± 3; 3, 28 ± 7) or GITR mIgG2a ((Exp.): 1,62 ± 4; 2 87 ± 1; 3, 81 ± 3) mAb administration, relative to untreated mice (n = 3–4 animals/group). Data are representative of three or more experiments. A Student’s t test was used to calculate significance in (B and C). Error bars indicate the SEM. **p < 0.01; ***p < 0.001. See also Figure S1.
Figure 2.
Figure 2.. Antigen-Specific T Cell Responses Enhanced by Anti-CTLA-4 mAb Require Intact FcγR Co-engagement
(A and B) Proliferation (Ki67+) of SEB-specific (Vβ8+, black lines) and non-specific (Vβ2+, gray lines) T cells (A) and the percentage of Vβ8+ and Vβ2+ T cells (B) evaluated by flow cytometry in the peripheral blood pre- (day 0) and post-treatment (days 3, 6, and 10) of C57BL/6 mice administered i.p. with 150 μg of SEB together with a 100-μg dose of anti-CTLA-4 mAb or mIgG2a isotype control mAb (n = 5 mice/group). A two-way ANOVA was used to calculate significance. (C and D) Intracellular flow cytometry for IL-2 produced by Vβ8+ and Vβ2+ T cells on day 6 post-SEB/mAb administration (C) and naive (CD44 CD62L+), effector (CD44+ CD62L+) and memory (CD44+ CD62L+) T cells represented as a percentage of the total Vβ8+ or Vβ2+ T cell fraction (D) in the samples in (A and B). A Student’s t test was used to calculate significance. Data are representative of three or more experiments. Error bars indicate SEM; ns, not significant; *p < 0.05; **p < 0.01; ***p < 0.001. See also Figure S2.
Figure 3.
Figure 3.. FcγR Co-engagement by Anti-CTLA-4 mAb Enhances Antigen-Specific T Cell Responses via a Treg Cell-Independent Mechanism
(A) C57BL/6 mice were administered i.p. with 150 μg of SEB together with a 100-μg i.p. dose of anti-CTLA-4, or a mIgG2a isotype control mAb (n = 5 mice/group). FoxP3+ Treg cell frequency was evaluated in the peripheral blood by flow cytometry pre- (day 0) and post-treatment (days 3, 6, and 10). (B) On day −10, C57BL/6 mice were administered i.p. with a single 250-μg dose of anti-CD25 mAb (clone PC61). On day 0, mice were given a 150-μg i.p. injection of SEB and 100 μg of anti-CTLA-4 mIgG2a mAb (n = 4 mice/group). FoxP3+ Treg cell frequency in the peripheral blood was assessed by flow cytometry pre- (day 0) and post-SEB/mAb injection (days 3 and 6). (C) Percentage of Vβ8+ effector (CD44+ CD62L) T cells in anti-CD25 mAb pre-conditioned mice on day 6 post-administration of SEB together with anti-CTLA-4 mIgG2a or mIgG2a isotype control mAb, as measured by flow cytometry. (D) FoxP3DTR transgenic mice were administered with 100 μg i.p. of diphtheria toxin (DT) on days −2 and −1 to systemically deplete FoxP3+ Treg cells. Frequency of FoxP3+ Treg cells in DT-treated and untreated (normalized to 100%) FoxP3DTR mice pre- (day 0) and post-SEB/mAb injection (days 3 and 6) was assessed in the peripheral blood by flow cytometry. (E and F) DT-treated mice in (D) were injected i.p. on day 0 with 150 μg of SEB and 100 μg anti-CTLA-4 mIgG2a or isotype control mAb (n = 4 mice/group). Total Vβ8+ T cells (E) and Vβ8+ effector (CD44+ CD62L) T cells (F) were evaluated in the peripheral blood on day 0 (pre-dose) and day 6 (post-treatment) by flow cytometry. A Student’s t test was used to calculate significance in (B–F). Data are representative of three or more experiments. Error bars indicate SEM; ns, not significant; **p < 0.01; ***p < 0.001. See also Figure S3.
Figure 4.
Figure 4.. Optimal Antigen-Specific T Cell Responses Produced by CTLA-4 mAbs Require FcγRIIIA (Human) or FcγRIV (Mouse) Co-engagement
(A) IL-2 production (day 4) by human PBMCs stimulated with 100 ng/mL of SEA peptide together with increasing concentrations of anti-CTLA-4, or isotype control mAbs. (B) IL-2 production (day 4) by PBMCs following blockade of the indicated FcγRs with FcγR-specific mAbs (10 μg/mL) for 15 min prior to co-incubation with SEA peptide (100 ng/mL) and anti-CTLA-4 hIgG1 mAb (10 μg/mL). (C) Representative flow cytometry plots of PBMCs depleted of FcγRIIIA+ cells (CD14+ and CD56+ cells were evaluated). (D) IL-2 production (day 4) by PBMCs stimulated with SEA peptide and anti-CTLA-4 hIgG1 mAb with or without pre-depletion of FcγRIIIA+ cells. (E) C57BL/6 mice were given i.p. injections of anti-FcγRIV mAb (clone 9E9) or hamster IgG isotype control (200 μg), together with SEB peptide (150 μg) and anti-CTLA-4 mIgG2a or isotype control mAb (100 μg) (n = 4 mice). The frequency of Vβ8+ effector (CD44+ CD62L) T cells was evaluated on day 6 by flow cytometry. Fold-change in IL-2 was calculated relative to a no mAb control (A, B, and D). A Student’s t test was used to calculate significance in (B, D, and E). Data are representative of three or more experiments. Error bars indicate SEM; ns, not significant; *p < 0.05; **p < 0.01; ***p < 0.001. See also Figure S4.
Figure 5.
Figure 5.. Improved Functionality of Anti-CTLA-4 mAb with Fc Engineering
(A) IL-2 production (day 4) by human PBMCs stimulated with 100 ng/mL of SEA peptide together with anti-CTLA-4 mAb variants or corresponding hIgG1 isotype control mAbs. (B and C) Kinetics of PBMC IL-2 production (B) and FoxP3+ Treg cell frequency (C) following stimulation with SEA peptide and the anti-CTLA-4 hIgG1 mAb variants in (A) or hIgG1 isotype control (10 μg/mL). (D) IL-10 production by human PBMCs following stimulation with SEA peptide and the anti-CTLA-4 hIgG1 mAb variants in (A) or hIgG1 isotype control (10 μg/mL). (E) Representative flow cytometry profiles of CD80, CD86, MHC class II, and FcγRs on PBMC-derived CD14+ monocytes or lineage-negative CD14 dendritic cell populations. (F) Representative flow cytometry plots and associated IL-2 production (day 4) from PBMCs with or without depletion of CD14+, CD56+, or co-depletion of CD14+ and CD56+ cells prior to stimulation with SEA peptide and anti-CTLA-4 mAbs (hIgG1 or hIgG1-DLE) or hIgG 1 isotype control (10 μg/mL). Fold-change in cytokine production (IL-2 or IL-10) was calculated relative to a no mAb control (A, B, D, and F). Data are representative of three or more experiments. A Student’s t test was used to calculate significance in (B–D and F). Error bars indicate SEM; ***p < 0.001. See also Figure S5.
Figure 6.
Figure 6.. Fc-FcγR Co-engagement by Anti-CTLA-4 mAbs Modulates TCR Signaling
(A) Enforced cell surface expression of CTLA-4 by Jurkat IL-2-luc T cells and endogenous expression of CD80 and CD86 on Raji APCs as compared with isotype control mAbs (gray). (B) Expression of FcγRs on Raji APCs, as compared with isotype control mAbs (gray). (C) Jurkat IL-2-luc T cell reporter activation following 8 hr co-culture with Raji APCs in the presence of increasing doses of anti-CTLA-4 mAb variants or hIgG1 isotype control mAb. Error bars indicate SEM. (D and E) Kinetic immunoblot analysis (D) and associated quantitative densitometry (E) of phosphorylated ZAP70 (Y-493) in human PBMCs following stimulation with 50 ng/mL of SEA peptide and 10 μg/mL of anti-CTLA-4 mAb variants (hIgG1, hIgG1-N297A, or hIgG1-DLE) or hIgG1 isotype control. See also Figure S6.
Figure 7.
Figure 7.. FcγR Co-engagement Is Important for Enhanced T Cell Responses Elicited by mAbs Targeting Other Immune Receptors
(A) BALB/c mice with established CT26 tumors (50–80 mm3) were administered i.p. twice weekly with 200 μg of anti-TIGIT mAbs or mIgG2a isotype control mAb (n = 5 mice/group). Tumor growth rates for individual mice are shown to the right. (B) Percent (%) reduction in intratumoral FoxP3+ Treg cells relative to untreated mice 24 hr post-administration of anti-TIGIT mAbs (200 μg, mIgG2a or mIgG2a-N297Q), anti-GITR mIgG2a (100 μg), or mIgG2a isotype control mAb (200 μg) (n = 4 mice/time point). (C) IL-2 production (day 4) by human PBMCs stimulated with 100 ng/mL of SEA peptide and 10 μg/mL of anti-TIGIT mAbs (hIgG1 or hIgG1-N297A) or corresponding isotype control mAbs. (D and E) IL-2 production (day 4) by PBMCs stimulated with SEA peptide (100 ng/mL) and anti-TIGIT hIgG1 mAb (10 μg/mL) with or without pre-blockade of the indicated FcγRs with glycosylated (D) or deglycosylated FcγR-specific mAbs (10 μg/mL) (E). (F) BALB/c mice were administered i.p. on day 0, 1, and 5 with 100 μg of anti-CD45RB mAb variants (rIgG2a, mIgG2a, and mIgG2a-N297A) or mIgG2a isotype control mAb. Spleens were collected on day 10, and FoxP3+ Treg cell frequency was evaluated by flow cytometry. Representative flow cytometry profiles (left), and quantitation (right) (n = 5 mice/group). Data are representative of three or more experiments. A Student’s t test was used to calculate significance in (C–F). Error bars indicate SEM; ns, not significant; **p < 0.01; ***p < 0.001.

References

    1. Acuto O, and Michel F (2003). CD28-mediated co-stimulation:aquantitative support for TCR signalling. Nat. Rev. Immunol 3, 939–951. - PubMed
    1. Arce Vargas F, Furness AJS, Litchfield K, Joshi K, Rosenthal R, Ghorani E, Solomon I, Lesko MH, Ruef N, Roddie C, et al. (2018). Fc effector function contributes to the activity of human anti-CTLA-4 antibodies. Cancer Cell 33, 649–663 e644. - PMC - PubMed
    1. Arce Vargas F, Furness AJS, Solomon I, Joshi K, Mekkaoui L, Lesko MH, Miranda Rota E, Dahan R, Georgiou A, Sledzinska A, et al. (2017). Fc-optimized anti-CD25 depletes tumor-infiltrating regulatory T cells and synergizes with PD-1 blockade to eradicate established tumors. Immunity 46, 577–586. - PMC - PubMed
    1. Arlauckas SP, Garris CS, Kohler RH, Kitaoka M, Cuccarese MF, Yang KS, Miller MA, Carlson JC, Freeman GJ, Anthony RM, et al. (2017). In vivo imaging reveals a tumor-associated macrophage-mediated resistance pathway in anti-PD-1 therapy. Sci. Transl. Med 9. - PMC - PubMed
    1. Brownlie RJ, and Zamoyska R (2013). T cell receptor signalling networks: branched, diversified and bounded. Nat. Rev. Immunol 13, 257–269. - PubMed

MeSH terms