

Bone healing response in cyclically loaded implants: Comparing zero, one, and two loading sessions per day
- PMID: 29894930
- PMCID: PMC6035061
- DOI: 10.1016/j.jmbbm.2018.05.044
Bone healing response in cyclically loaded implants: Comparing zero, one, and two loading sessions per day
Abstract
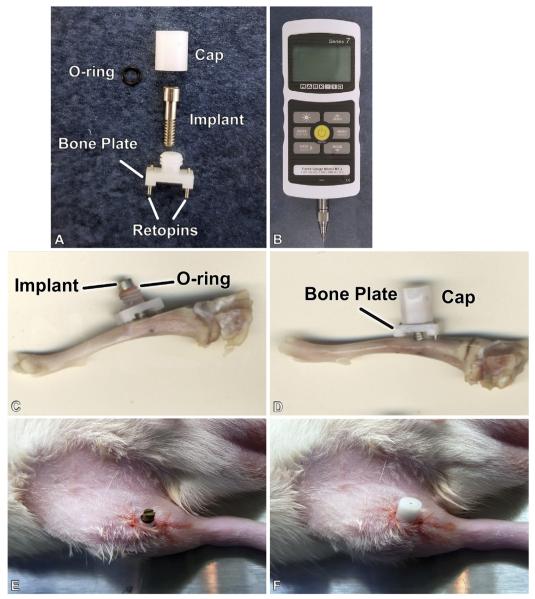
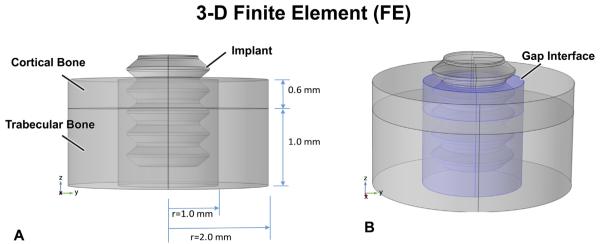
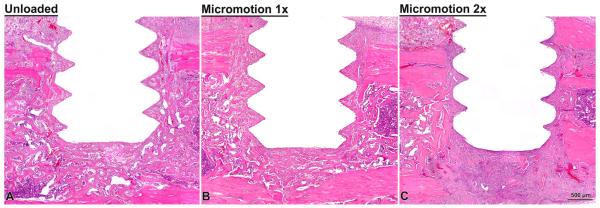
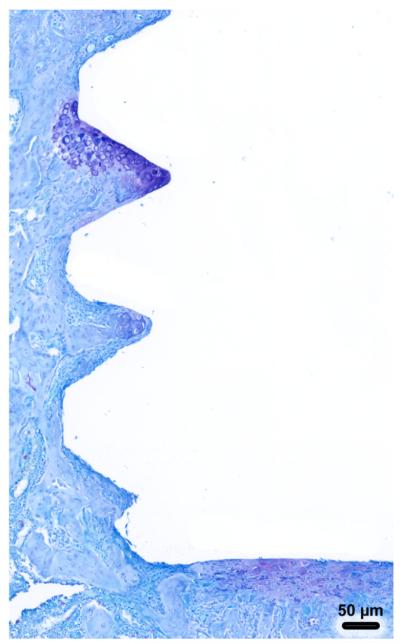
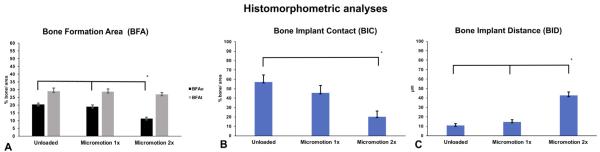
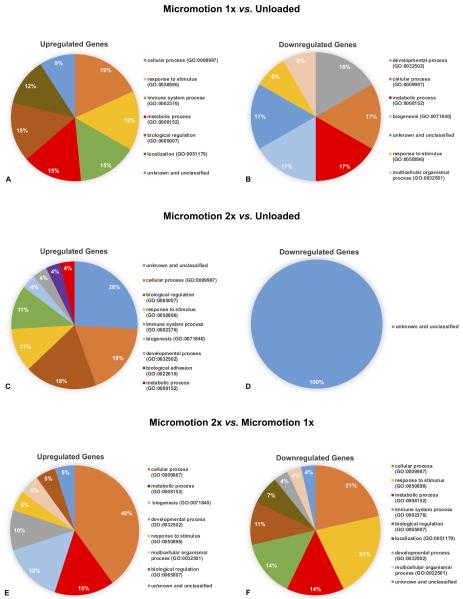
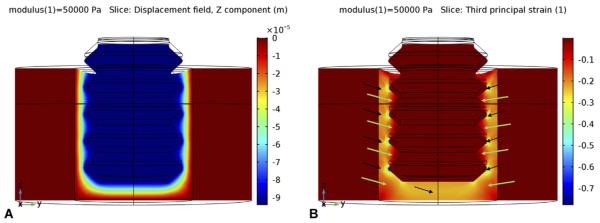
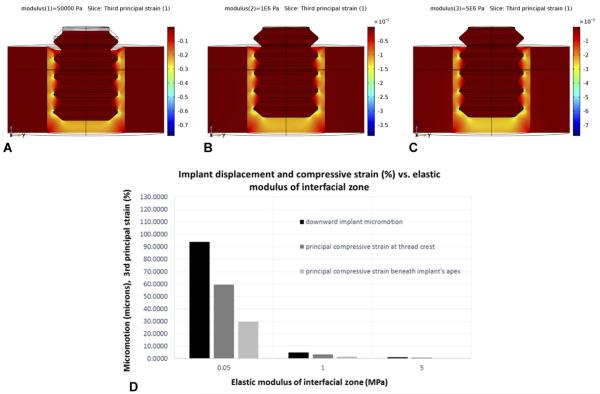
When bone implants are loaded, they are inevitably subjected to displacement relative to bone. Such micromotion generates stress/strain states at the interface that can cause beneficial or detrimental sequels. The objective of this study is to better understand the mechanobiology of bone healing at the tissue-implant interface during repeated loading. Machined screw shaped Ti implants were placed in rat tibiae in a hole slightly bigger than the implant diameter. Implants were held stable by a specially-designed bone plate that permits controlled loading. Three loading regimens were applied, (a) zero loading, (b) one daily loading session of 60 cycles with an axial force of 1.5 N/cycle for 7 days, and (c) two such daily sessions with the same axial force also for 7 days. Finite element analysis was used to characterize the mechanobiological conditions produced by the loading sessions. After 7 days, the implants with surrounding interfacial tissue were harvested and processed for histological, histomorphometric and DNA microarray analyses. Histomorphometric analyses revealed that the group subjected to repeated loading sessions exhibited a significant decrease in bone-implant contact and increase in bone-implant distance, as compared to unloaded implants and those subjected to only one loading session. Gene expression profiles differed during osseointegration between all groups mainly with respect to inflammatory and unidentified gene categories. The results indicate that increasing the daily cyclic loading of implants induces deleterious changes in the bone healing response, most likely due to the accumulation of tissue damage and associated inflammatory reaction at the bone-implant interface.
Keywords: Bone; Gene expression; Histomorphometry; Implant; Loading; Micromotion.
Copyright © 2018 The Authors. Published by Elsevier Ltd.. All rights reserved.
Figures
Similar articles
-
Influence of Nanotopography on Early Bone Healing during Controlled Implant Loading.Nanomaterials (Basel). 2020 Nov 3;10(11):2191. doi: 10.3390/nano10112191. Nanomaterials (Basel). 2020. PMID: 33153132 Free PMC article.
-
System for application of controlled forces on dental implants in rat maxillae: Influence of the number of load cycles on bone healing.J Biomed Mater Res B Appl Biomater. 2020 Apr;108(3):965-975. doi: 10.1002/jbm.b.34449. Epub 2019 Jul 31. J Biomed Mater Res B Appl Biomater. 2020. PMID: 31368244 Free PMC article.
-
Micromotion-induced strain fields influence early stages of repair at bone-implant interfaces.Acta Biomater. 2013 May;9(5):6663-74. doi: 10.1016/j.actbio.2013.01.014. Epub 2013 Jan 19. Acta Biomater. 2013. PMID: 23337705 Free PMC article.
-
Enhancement of implant osseointegration by high-frequency low-magnitude loading.PLoS One. 2012;7(7):e40488. doi: 10.1371/journal.pone.0040488. Epub 2012 Jul 10. PLoS One. 2012. PMID: 22808172 Free PMC article.
-
In vivo bone response to biomechanical loading at the bone/dental-implant interface.Adv Dent Res. 1999 Jun;13:99-119. doi: 10.1177/08959374990130012301. Adv Dent Res. 1999. PMID: 11276755 Review.
Cited by
-
[Numerical simulation of fracture healing].Sheng Wu Yi Xue Gong Cheng Xue Za Zhi. 2020 Oct 25;37(5):930-935. doi: 10.7507/1001-5515.202004010. Sheng Wu Yi Xue Gong Cheng Xue Za Zhi. 2020. PMID: 33140619 Free PMC article. Chinese.
-
Influence of Nanotopography on Early Bone Healing during Controlled Implant Loading.Nanomaterials (Basel). 2020 Nov 3;10(11):2191. doi: 10.3390/nano10112191. Nanomaterials (Basel). 2020. PMID: 33153132 Free PMC article.
-
System for application of controlled forces on dental implants in rat maxillae: Influence of the number of load cycles on bone healing.J Biomed Mater Res B Appl Biomater. 2020 Apr;108(3):965-975. doi: 10.1002/jbm.b.34449. Epub 2019 Jul 31. J Biomed Mater Res B Appl Biomater. 2020. PMID: 31368244 Free PMC article.
References
-
- Birkhold AI Razi H Duda GN Weinkamer R Checa S Willie BM Mineralizing surface is the main target of mechanical stimulation independent of age: 3D dynamic in vivo morphometry Bone 2014. 66 15–25 - PubMed
-
- Brunski JB In vivo bone response to biomechanical loading at the bone-dental implant interface Adv. Dent. Res 1999. 13 99–119 - PubMed
-
- De Smet E Jaecques S Vandamme K Vander Sloten J Naert I Positive effect of early loading on implant stability in the bi-cortical guinea-pig model Clin. Oral Implants Res 2005. 16 402–407 - PubMed
Publication types
MeSH terms
Grants and funding
LinkOut - more resources
Full Text Sources
Other Literature Sources
