

Daughters of the budding yeast from old mothers have shorter replicative lifespans but not total lifespans. Are DNA damage and rDNA instability the factors that determine longevity?
- PMID: 29895191
- PMCID: PMC6110580
- DOI: 10.1080/15384101.2018.1464846
Daughters of the budding yeast from old mothers have shorter replicative lifespans but not total lifespans. Are DNA damage and rDNA instability the factors that determine longevity?
Abstract
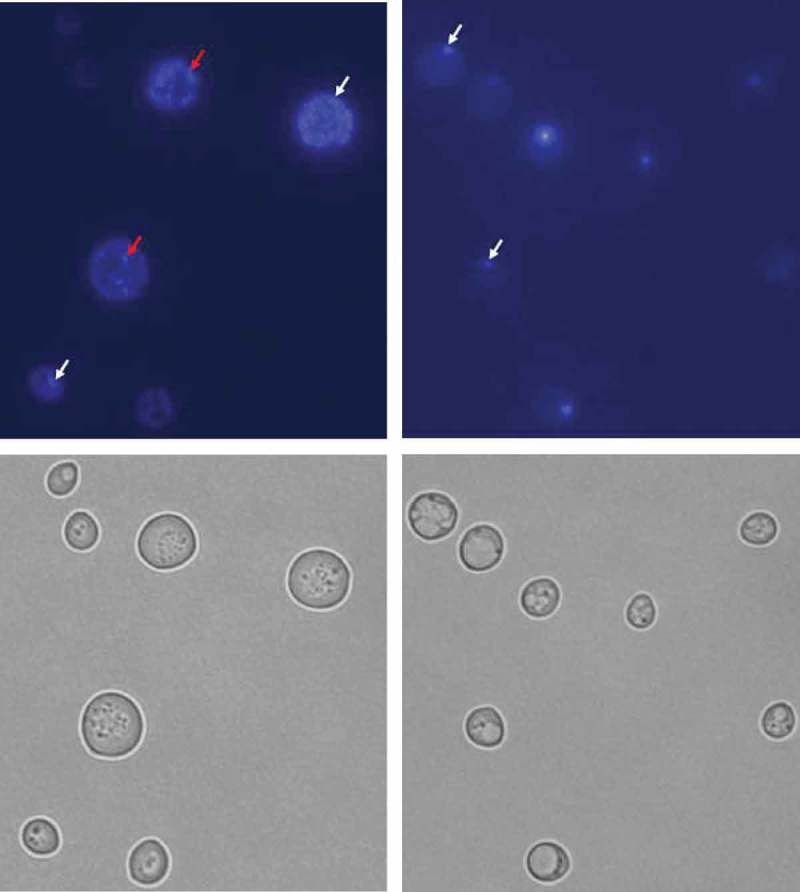
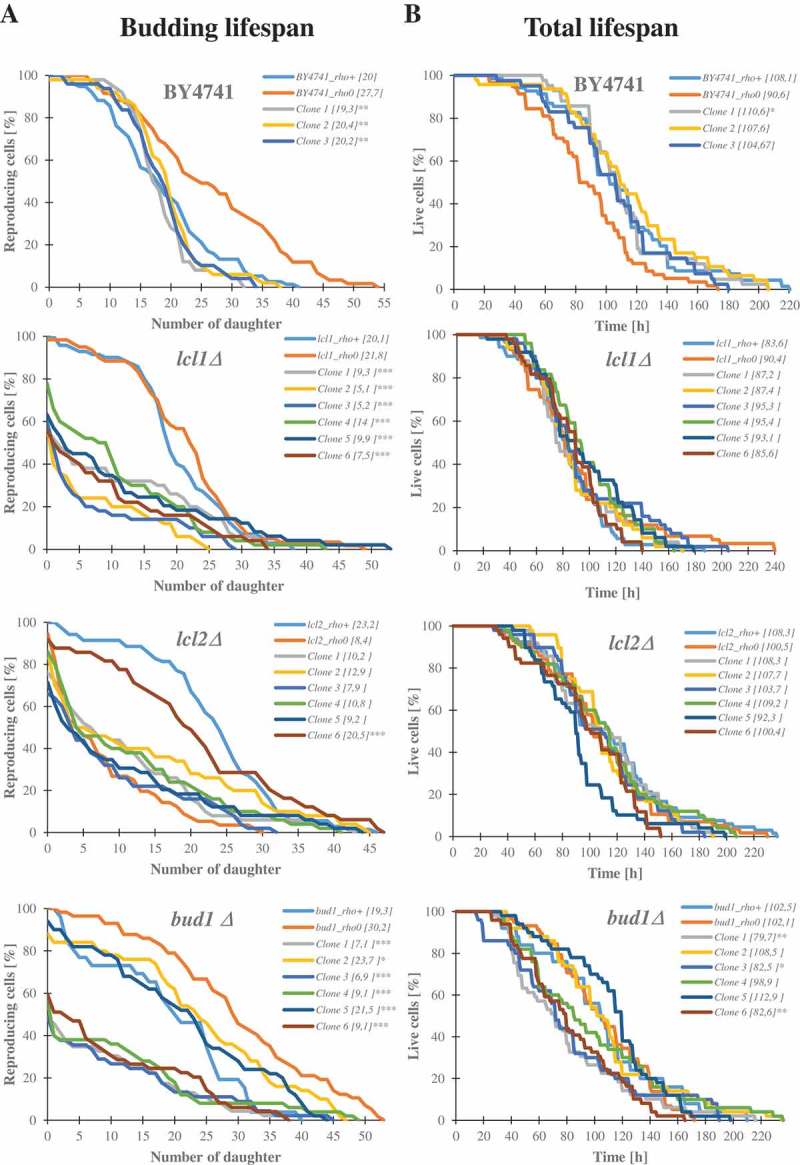
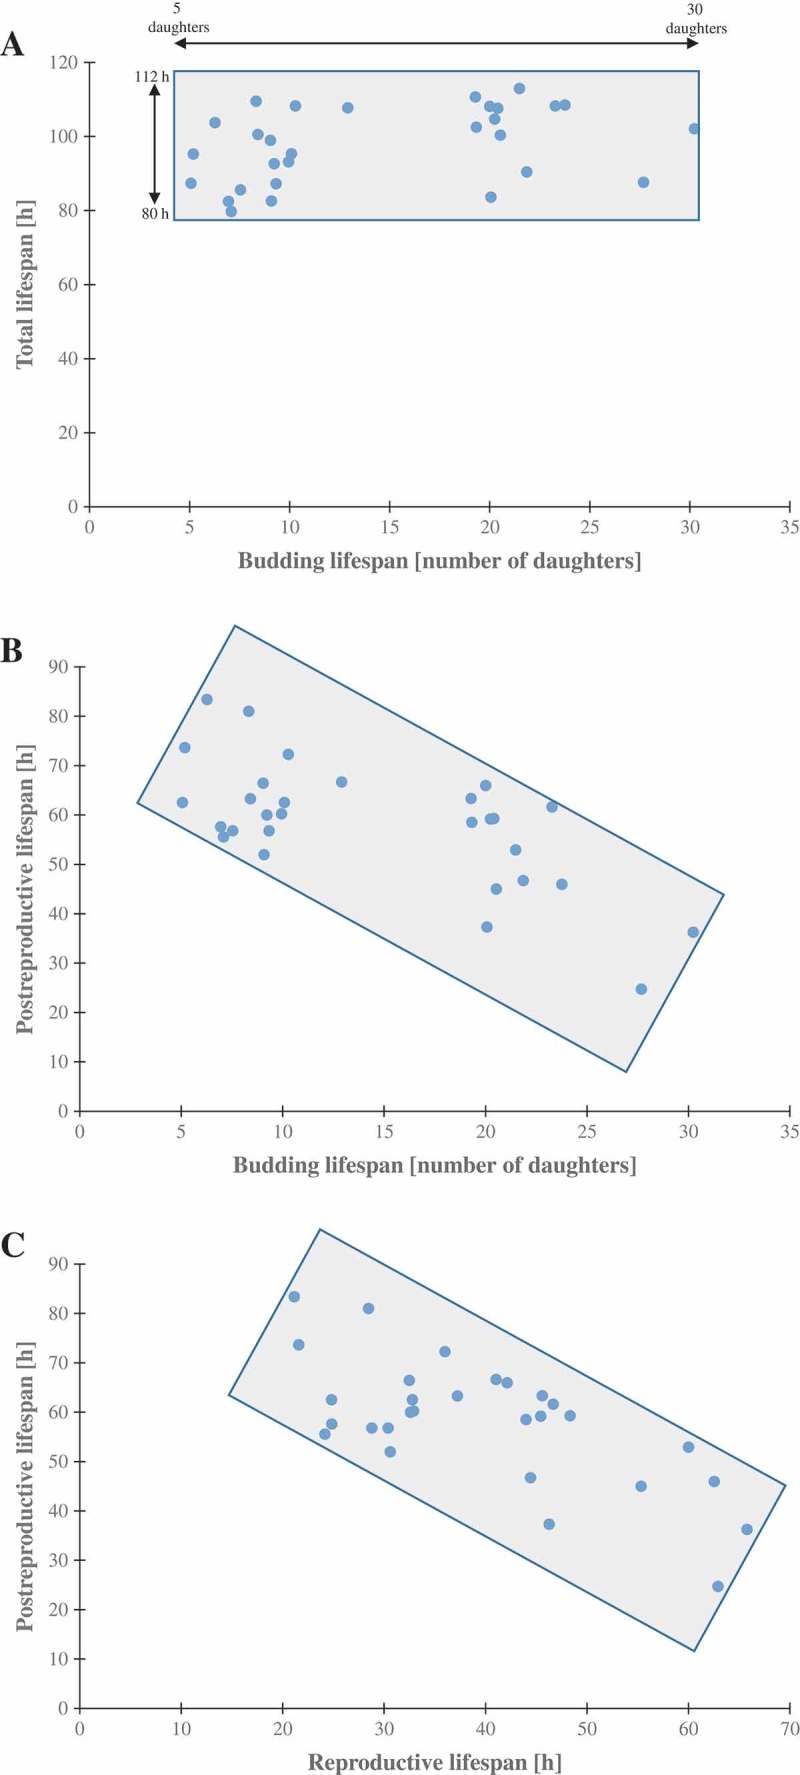
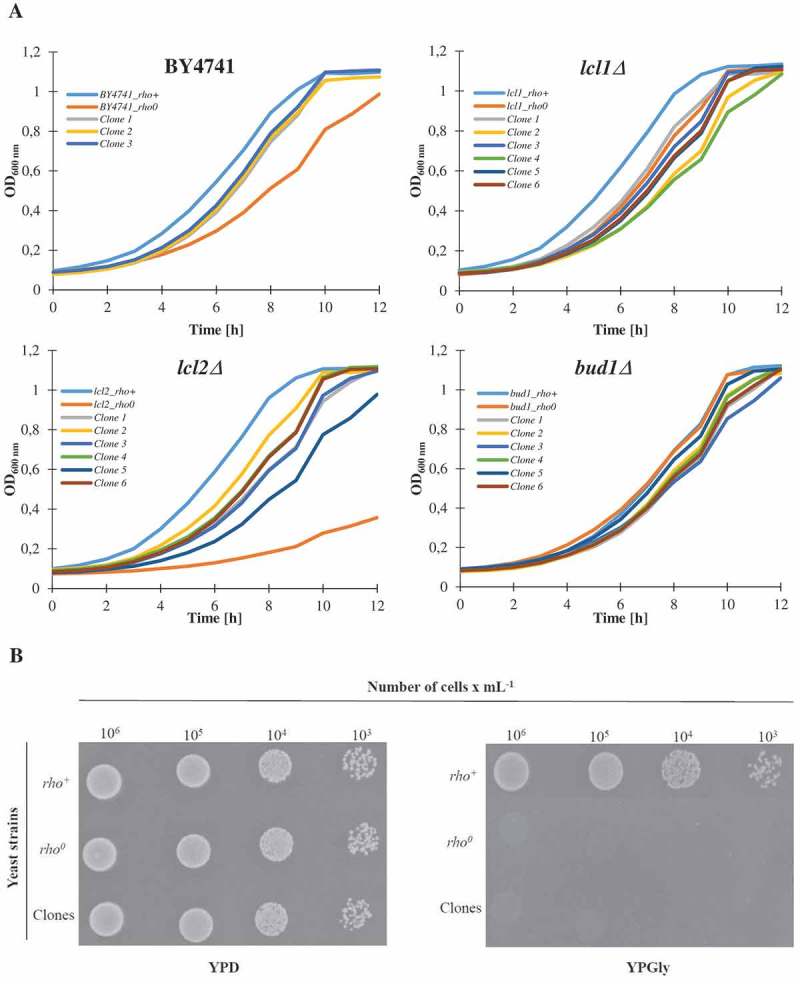
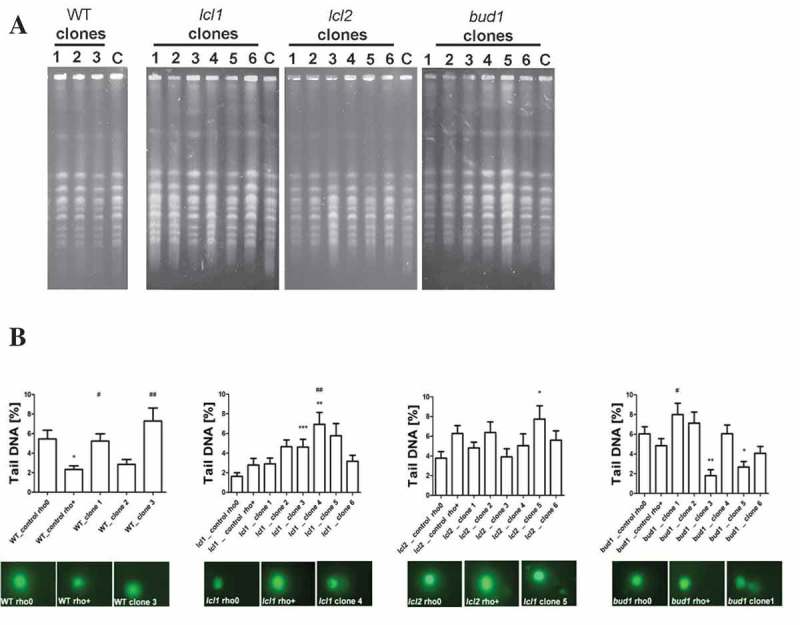
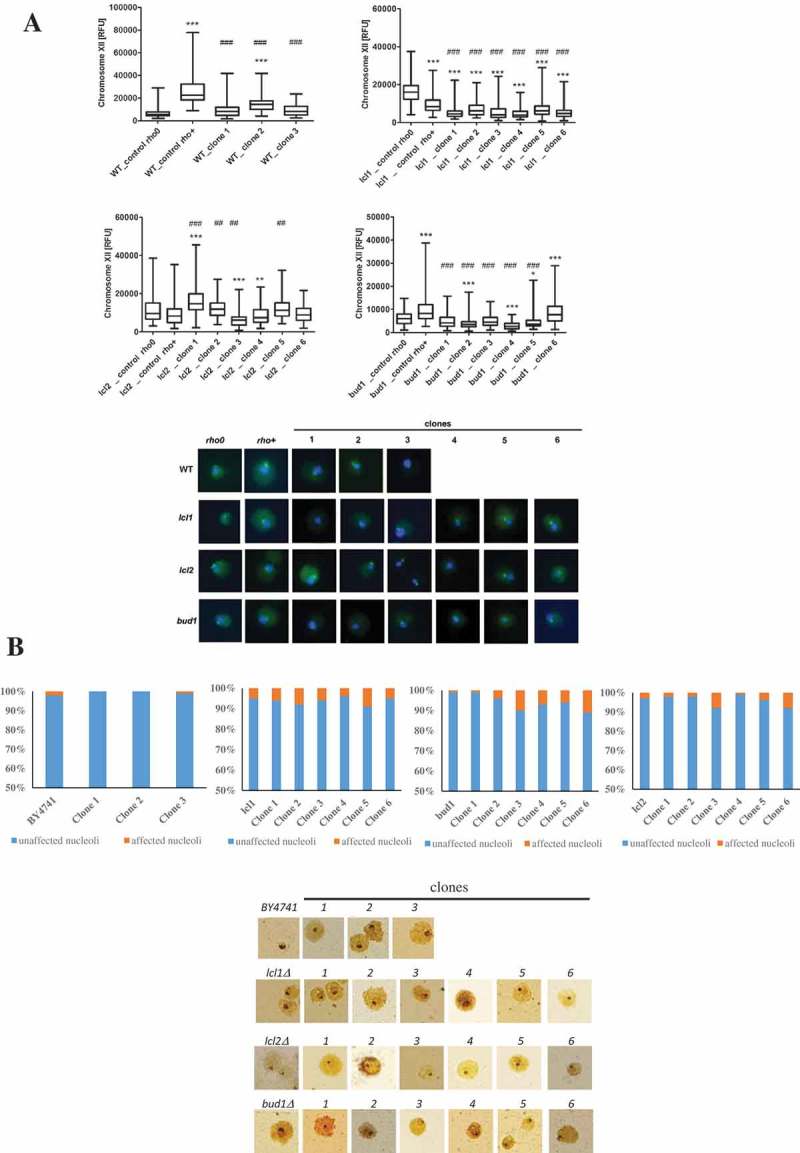
Although a lot of effort has been put into the search for factors responsible for aging in yeast mother cells, our knowledge of cellular changes in daughter cells originating from old mothers is still very limited. It has been shown that an old mother is not able to compensate for all negative changes within its cell and therefore transfers them to the bud. In this paper, we show for the first time that daughter cells of an old mother have a reset lifespan expressed in units of time despite drastic reduction of their budding lifespan, which suggests that a single yeast cell has a fixed programmed longevity regardless of the time point at which it was originated. Moreover, in our study we found that longevity parameters are not correlated with the rDNA level, DNA damage, chromosome structure or aging parameters (budding lifespan and total lifespan).
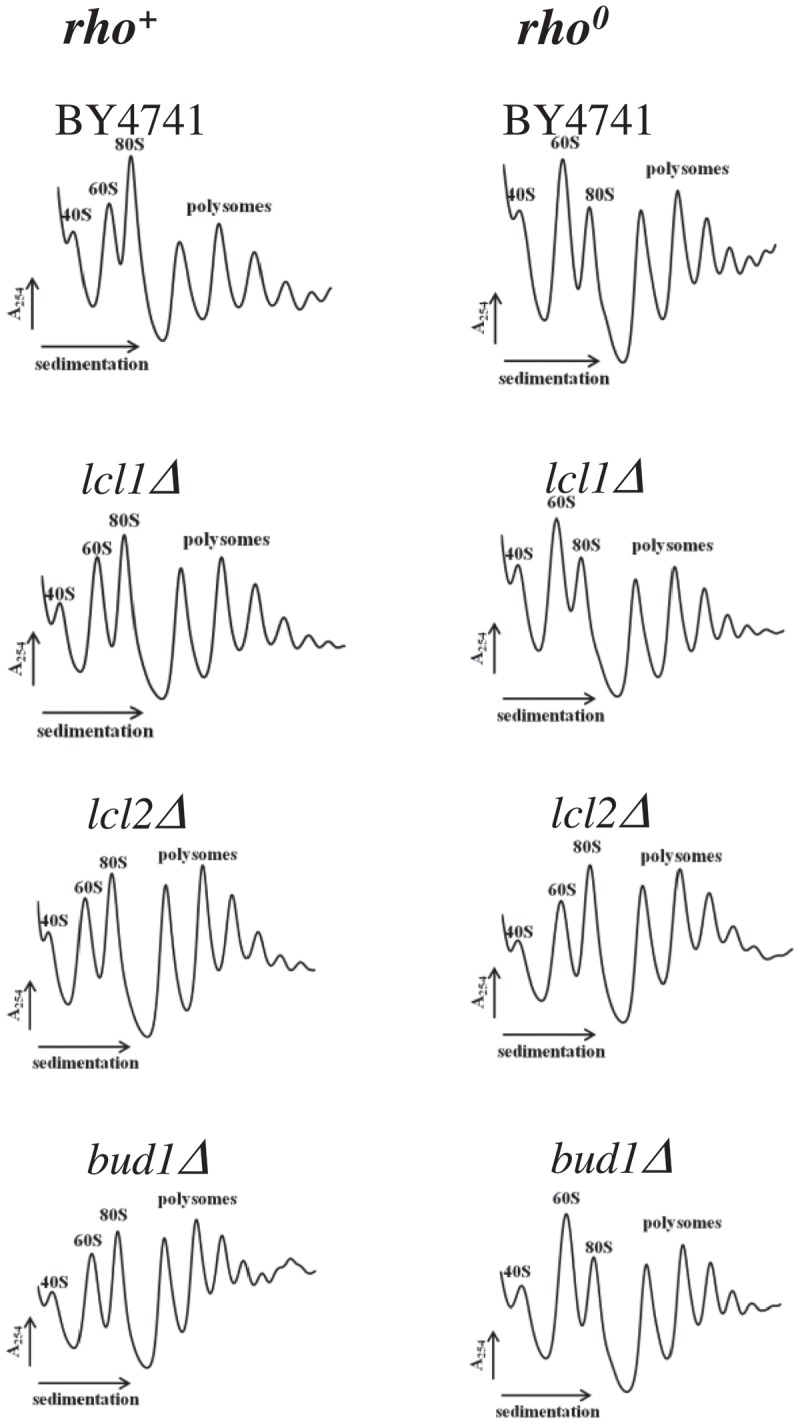
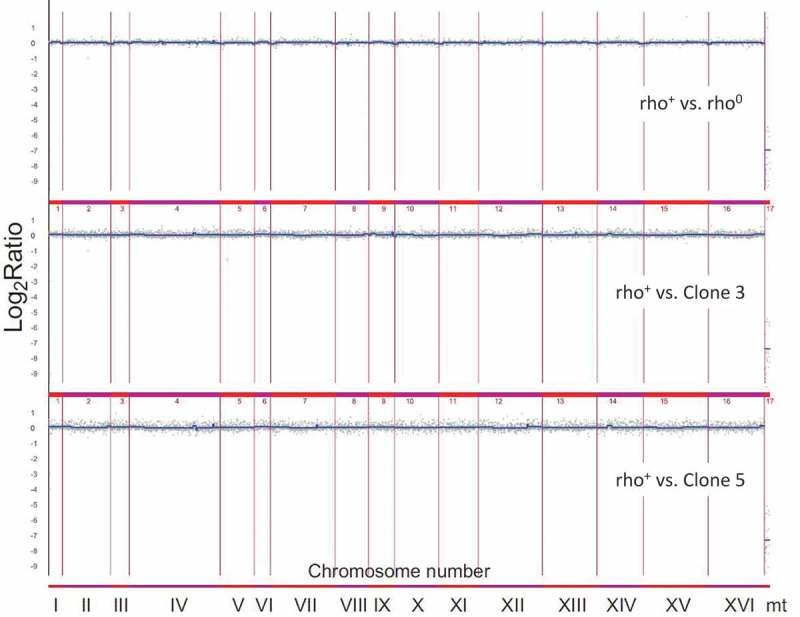
Keywords: Yeast; aCGH; aging; longevity; mtDNA; polysome.
Figures
Similar articles
-
Impaired cohesion and homologous recombination during replicative aging in budding yeast.Sci Adv. 2018 Feb 7;4(2):eaaq0236. doi: 10.1126/sciadv.aaq0236. eCollection 2018 Feb. Sci Adv. 2018. PMID: 29441364 Free PMC article.
-
rDNA array length is a major determinant of replicative lifespan in budding yeast.Proc Natl Acad Sci U S A. 2022 Apr 12;119(15):e2119593119. doi: 10.1073/pnas.2119593119. Epub 2022 Apr 8. Proc Natl Acad Sci U S A. 2022. PMID: 35394872 Free PMC article.
-
Deregulation of the G1/S-phase transition is the proximal cause of mortality in old yeast mother cells.Genes Dev. 2018 Aug 1;32(15-16):1075-1084. doi: 10.1101/gad.312140.118. Epub 2018 Jul 24. Genes Dev. 2018. PMID: 30042134 Free PMC article.
-
DNA damage and DNA replication stress in yeast models of aging.Subcell Biochem. 2012;57:187-206. doi: 10.1007/978-94-007-2561-4_9. Subcell Biochem. 2012. PMID: 22094423 Review.
-
Yeast mother cell-specific ageing, genetic (in)stability, and the somatic mutation theory of ageing.Nucleic Acids Res. 2007;35(22):7514-26. doi: 10.1093/nar/gkm919. Epub 2007 Nov 6. Nucleic Acids Res. 2007. PMID: 17986449 Free PMC article. Review.
Cited by
-
Depletion of the Origin Recognition Complex Subunits Delays Aging in Budding Yeast.Cells. 2022 Apr 7;11(8):1252. doi: 10.3390/cells11081252. Cells. 2022. PMID: 35455932 Free PMC article.
-
Increasing the number of ribosomal uL6 mRNA copies accelerates aging of the budding yeast.Mol Biol Rep. 2023 Mar;50(3):2933-2941. doi: 10.1007/s11033-022-08187-2. Epub 2022 Dec 28. Mol Biol Rep. 2023. PMID: 36576675 Free PMC article.
-
Genome-wide screens in yeast models towards understanding chronological lifespan regulation.Brief Funct Genomics. 2022 Jan 25;21(1):4-12. doi: 10.1093/bfgp/elab011. Brief Funct Genomics. 2022. PMID: 33728458 Free PMC article.
-
Dual roles of mitochondrial fusion gene FZO1 in yeast age asymmetry and in longevity mediated by a novel ATG32-dependent retrograde response.Biogerontology. 2019 Feb;20(1):93-107. doi: 10.1007/s10522-018-9779-z. Epub 2018 Oct 8. Biogerontology. 2019. PMID: 30298458
-
Impact of curcumin on replicative and chronological aging in the Saccharomyces cerevisiae yeast.Biogerontology. 2020 Feb;21(1):109-123. doi: 10.1007/s10522-019-09846-x. Epub 2019 Oct 28. Biogerontology. 2020. PMID: 31659616 Free PMC article.
References
-
- Kirkwood TBL, Austad SN.. Why do we age? Nature. 2000;408:233–238. - PubMed
-
- Fabrizio P, Longo VD. The chronological life span of Saccharomyces cerevisiae. Aging Cell. 2003;2:73–81. - PubMed
-
- MacLean M, Harris N, Piper PW. Chronological lifespan of stationary phase yeast cells; a model for investigating the factors that might influence the ageing of postmitotic tissues in higher organisms. Yeast. 2001;18:499–509. - PubMed
Publication types
MeSH terms
Substances
LinkOut - more resources
Full Text Sources
Other Literature Sources
Molecular Biology Databases