. 2018 Jun 12;16(1):65.
doi: 10.1186/s12915-018-0525-4.

Glucocorticoid-dependent REDD1 expression reduces muscle metabolism to enable adaptation under energetic stress

Affiliations

Glucocorticoid-dependent REDD1 expression reduces muscle metabolism to enable adaptation under energetic stress

Florian A Britto et al. BMC Biol. .

Abstract

Background: Skeletal muscle atrophy is a common feature of numerous chronic pathologies and is correlated with patient mortality. The REDD1 protein is currently recognized as a negative regulator of muscle mass through inhibition of the Akt/mTORC1 signaling pathway. REDD1 expression is notably induced following glucocorticoid secretion, which is a component of energy stress responses.

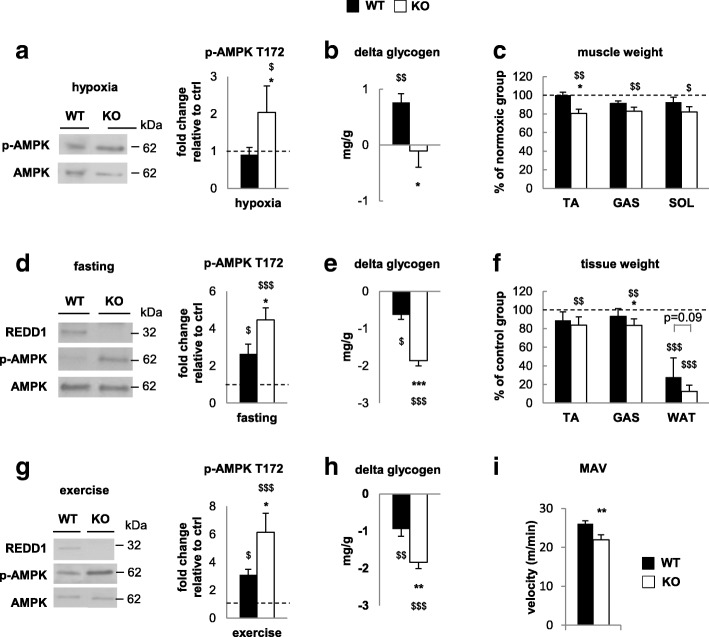
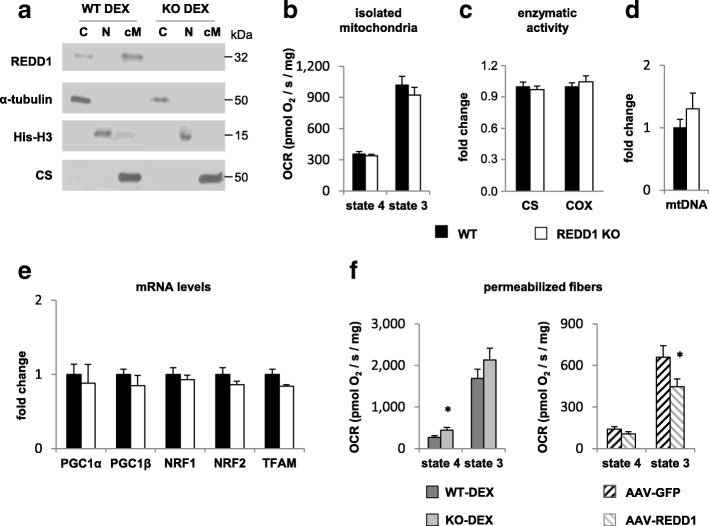
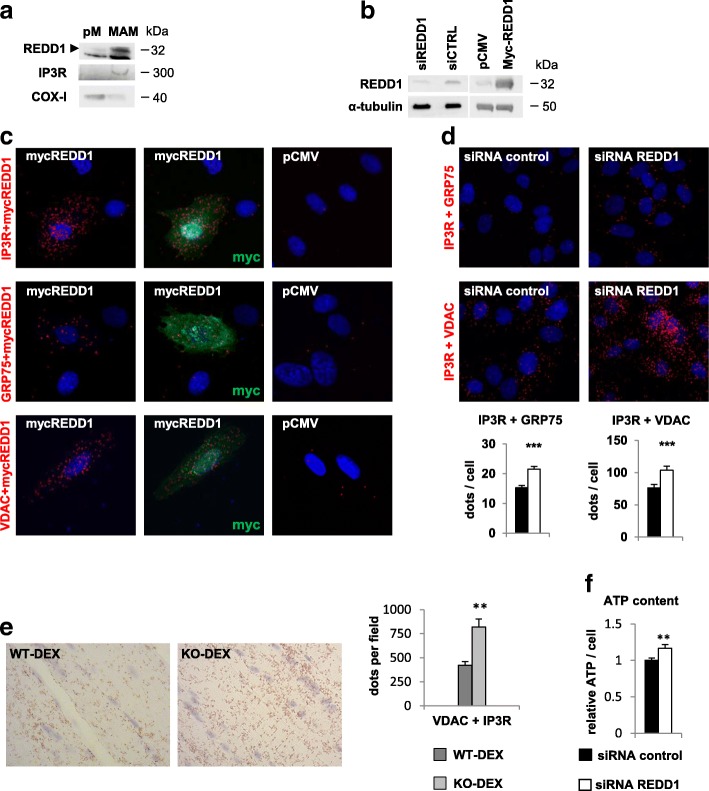
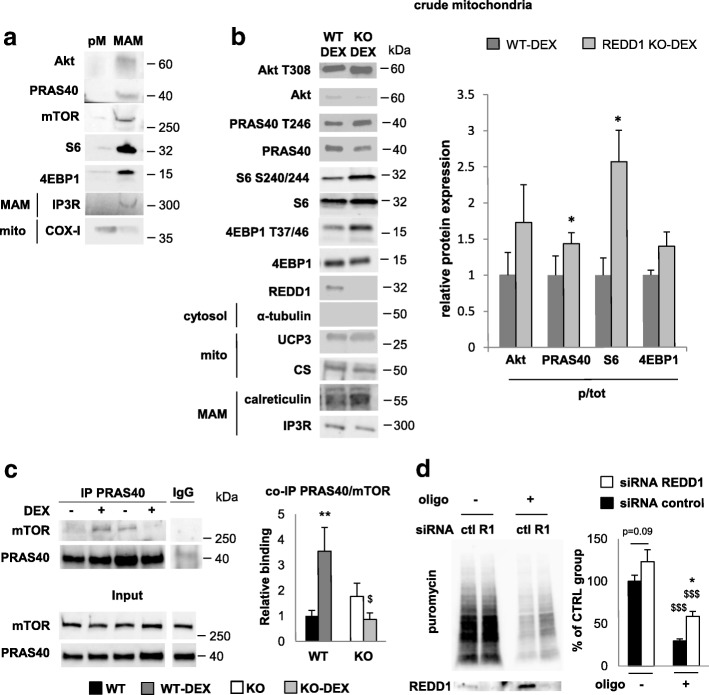
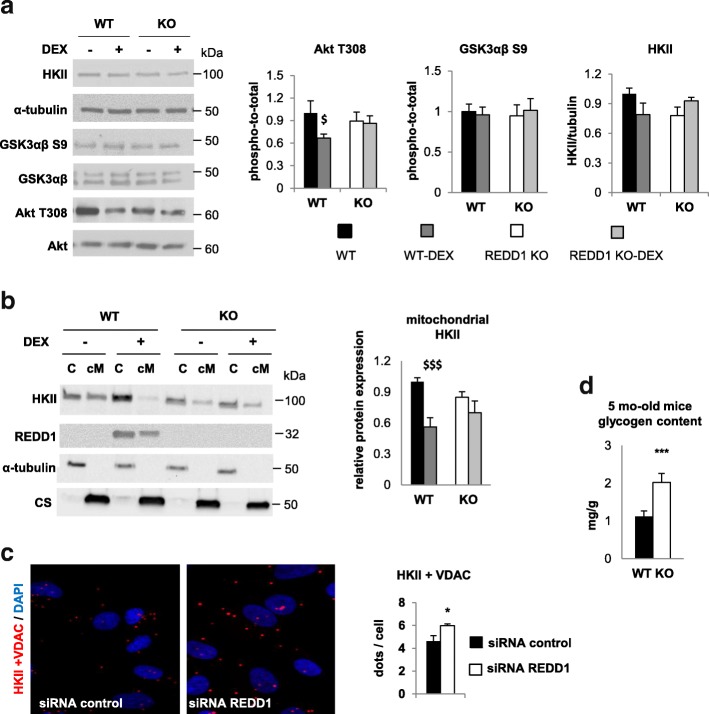
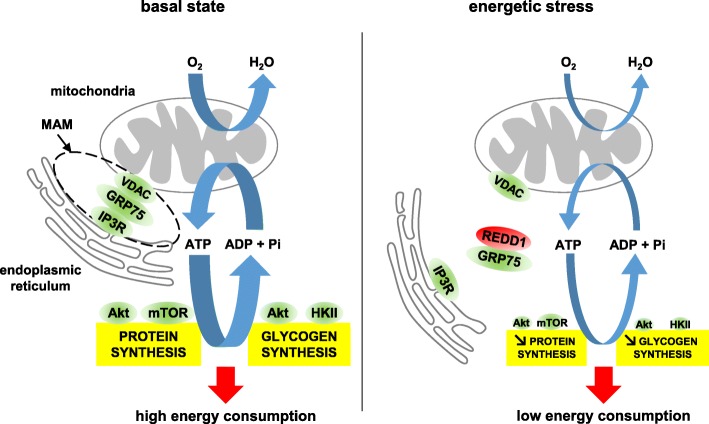
Results: Unexpectedly, we show here that REDD1 instead limits muscle loss during energetic stresses such as hypoxia and fasting by reducing glycogen depletion and AMPK activation. Indeed, we demonstrate that REDD1 is required to decrease O2 and ATP consumption in skeletal muscle via reduction of the extent of mitochondrial-associated endoplasmic reticulum membranes (MAMs), a central hub connecting energy production by mitochondria and anabolic processes. In fact, REDD1 inhibits ATP-demanding processes such as glycogen storage and protein synthesis through disruption of the Akt/Hexokinase II and PRAS40/mTORC1 signaling pathways in MAMs. Our results uncover a new REDD1-dependent mechanism coupling mitochondrial respiration and anabolic processes during hypoxia, fasting, and exercise.

Conclusions: Therefore, REDD1 is a crucial negative regulator of energy expenditure that is necessary for muscle adaptation during energetic stresses. This present study could shed new light on the role of REDD1 in several pathologies associated with energetic metabolism alteration, such as cancer, diabetes, and Parkinson's disease.

Keywords: Energy expenditure; Exercise; Fasting; Hypoxia; MAMs; Metabolism; Mitochondria; Skeletal muscle; mTOR.


Conflict of interest statement

Ethics approval and consent to participate

All procedures on mice comply with European directives (86/609/CEE) and were approved by the national ethics committee (referral file APAFIS#9706-2017042516166776 v3).

Competing interests

The authors declare that they have no competing interests.

Publisher’s Note

Springer Nature remains neutral with regard to jurisdictional claims in published maps and institutional affiliations.

Figures

Fig. 1
Fig. 1
REDD1 deletion exacerbates energetic stress. a AMPK phosphorylation, b glycogen content, and c muscle weight of gastrocnemius (GAS), tibialis anterior (TA), and soleus (SOL) in 6-month-old WT and REDD1 KO mice exposed to 2 weeks of hypobaric hypoxia (6500 m) relative to normoxic controls (n = 7 per group, except for b KO n = 6). d AMPK phosphorylation, e glycogen content, and f weight of gastrocnemius (GAS), tibialis anterior (TA), and perigonadal white adipose tissue (WAT) in 6-month-old WT and REDD1 KO mice in response to food deprivation for 16 h (d and e) or 48 h (f) relative to fed controls (n = 8 per group except for f WT n = 6 and KO n = 7). g AMPK phosphorylation (n = 6 per group) and h glycogen content (WT n = 8 and KO n = 7) in skeletal muscle after a 90-min running exercise by 6-month-old WT and REDD1 KO mice relative to sedentary controls. i Maximum aerobic velocity (MAV) in 6-month-old WT and REDD1 KO mice (n = 11 per group). For clarity, we presented here only data normalized to their respective controls. All non-normalized values are available in Additional file 2: Figure S1. *p < 0.05, **p < 0.01, and ***p < 0.001 vs. corresponding WT group, and $p < 0.05, $$p < 0.01, and $$$p < 0.001 vs. corresponding to control group (same genotype) by two-way ANOVA and Fisher post-hoc test (a–h) or unpaired t-test (i). GAS gastrocnemius, KO knockout, MAV maximum aerobic velocity, SOL soleus, TA tibialis anterior, WAT white adipose tissue, WT wild type
Fig. 2
Fig. 2
REDD1 reduces O2 consumption in skeletal muscle. a GAS skeletal muscle subcellular fractionation in REDD1 KO and WT mice 5 h after DEX treatment. The quality of fractionation was checked by detecting proteins specifically localized in each fraction: α-tubulin for the cytosol, histone-H3 (his-H3) for the nucleus, and citrate synthase (CS) for mitochondria. Mitochondria purity was also observed by transmission electron microscopy (Additional file 2: Figure S8). b O2 consumption rate (OCR) and respiratory control ratio (i.e., state 3 to state 4 ratio) of isolated mitochondria from skeletal muscles (GAS, QUAD, and TA) in the presence of lipidic substrates (palmitoylcarnitine + malate) in WT (n = 8) and REDD1 KO mice (n = 10). c Citrate synthase and cytochrome C oxidase (COX) basal activity in GAS muscle of WT and REDD1 KO mice (n = 7 per group). d Mitochondrial DNA (WT n = 5 and KO n = 6) and e expression of genes involved in mitochondrial biogenesis in WT (n = 7) and REDD1 KO mice (n = 6). f O2 consumption rate of permeabilized fibers from TA of WT and REDD1 KO mice treated with dexamethasone (DEX; n = 6 per group) and WT mice injected with AAV6 vectors encoding green fluorescent protein (GFP) or murine REDD1 (n = 12 per group). *p < 0.05 vs. corresponding control group by unpaired t-test. C cytosol, cM crude mitochondria, COX cytochrome C oxidase, CS citrate synthase, DEX dexamethasone, GAS gastrocnemius, GFP green fluorescent protein, his-H3 histone-H3, KO knockout, mtDNA mitochondrial DNA, N nucleus, NRF nuclear respiratory factor, OCR O2 consumption rate, PGC peroxisome proliferator-activated receptor gamma coactivator, QUAD quadriceps, TA tibialis anterior, TFAM mitochondrial transcription factor A, WT wild type
Fig. 3
Fig. 3
REDD1 interacts with and modulates the extent of MAMs. a Pure mitochondria (pM) and MAMs fraction obtained from WT mice skeletal muscle 5 h after DEX treatment (1 mg/kg). Inositol trisphosphate receptor (IP3R) and cytochrome C oxidase-I (COX-I) are specific to MAMs and the mitochondria compartments, respectively. b Representative blots for REDD1 knockdown by siRNA or REDD1 overexpression in human myoblasts. c Proximity ligation assay between IP3R and REDD1, GRP75 and REDD1, or VDAC and REDD1 in human myoblasts transfected with either an empty vector (pCMV) or a plasmid encoding murine REDD1 fused to Myc (mycREDD1). d Representative pictures and corresponding quantifications of proximity ligation assay between GRP75 and IP3R or VDAC and IP3R with either control siRNA or siRNA against REDD1 in human primary myoblasts (n = 6 per condition from three separate cultures). e Representative images and quantitative analysis of the VDAC1/IP3R1 interactions measured by in situ proximity ligation assay in paraffin-embedded muscle from WT (n = 5) and REDD1 KO mice (n = 6) treated for 5 h with DEX. f ATP content measured by luciferase assay in human primary myoblasts transfected with either control siRNA (n = 10 from three separate cultures) or siRNA REDD1 (n = 11 from three separate cultures). **p < 0.01 and ***p < 0.001 vs. control by unpaired t-test. COX cytochrome C oxidase, DEX dexamethasone, IP3R inositol trisphosphate receptor, KO knockout, MAMs mitochondrial-associated endoplasmic reticulum membranes, pM pure mitochondria, VDAC voltage-dependent anion channel, WT wild type
Fig. 4
Fig. 4
REDD1 inhibits the Akt/mTOR pathway in the mitochondria/ER interface. a Pure mitochondria (pM) and MAMs fraction obtained from skeletal muscle of WT mice 5 h after DEX treatment (1 mg/kg). The quality of fractionation was checked by detecting proteins specifically localized in each fraction (IP3R for MAMs and COX-I for mitochondria). b Crude mitochondrial protein expression in WT and REDD1 KO mice acutely treated with DEX (1 mg/kg; n = 3 per group except for S6 WT, 4EBP1 WT, and KO: n = 4). CS and uncoupling protein 3 (UCP3) were used as markers for mitochondria (mito). The presence of MAMs was checked by calreticulin and IP3R expression. c mTORC and PRAS40 association in crude mitochondrial lysate of WT and REDD1 KO mice acutely treated with DEX (1 mg/kg; WT n = 7, WT-DEX n = 6, KO n = 3, and KO-DEX n = 4). d Representative blots for puromycin incorporation and corresponding quantification in human myoblasts treated with either siRNA control (ctl) or siRNA directed against REDD1 (R1) after 1 h of glucose deprivation and treatment with the ATP synthase inhibitor oligomycin (2 μmol/l; n = 3 per group from three separate cultures). *p < 0.05 vs. corresponding control. $$$p < 0.001 vs. oligomycin-treated cells by unpaired t-test (b) or two-way ANOVA and Fisher post-hoc test (c, d). COX cytochrome C oxidase, CS citrate synthase, ctl control, DEX dexamethasone, IP3R inositol trisphosphate receptor, KO knockout, MAMs mitochondrial-associated endoplasmic reticulum membranes, mito mitochondria, oligo oligomycin, pM pure mitochondria, p/tot phospho-to-total ratio, R1 REDD1, UCP3 uncoupling protein 3, WT wild type
Fig. 5
Fig. 5
REDD1 controls Hexokinase II (HKII) mitochondrial localization. a Akt T308 (WT n = 8, WT-DEX n = 9, KO n = 7, and KO-DEX n = 8), GSK3 S9 (WT and KO n = 8, and WT-DEX and KO-DEX n = 7) and HKII (WT, WT-DEX, and KO-DEX n = 7 and KO n = 8) protein expression in total lysate and b cytosolic (C) and crude mitochondrial (cM) subcellular localization of HKII in WT and REDD1 KO mice acutely treated with 1 mg/kg of dexamethasone (DEX; WT n = 7, WT-DEX n = 6, KO n = 3, and KO-DEX n = 4). c Representative pictures and corresponding quantifications of proximity ligation assay between VDAC and HKII with either control siRNA or siRNA against REDD1 in human primary myoblasts (n = 7 per condition from one culture). d Glycogen content in gastrocnemius of WT (n = 11) and REDD1 KO mice (n = 13). $p < 0.05 and $$$p < 0.001 vs. corresponding untreated group by two-way ANOVA and Fisher post-hoc test (a, b). *p < 0.05 and ***p < 0.001 vs. WT or control siRNA by unpaired t-test (c, d). C cytosol, cM crude mitochondria, CS citrate synthase, DEX dexamethasone, KO knockout, VDAC voltage-dependent anion channel, WT wild type
Fig. 6
Fig. 6
REDD1 deletion increases basal metabolism in vivo. a Basal whole-body O2 and CO2 fluxes in young (2 months) and adult mice (12 months; n = 6 per group). b Global and immobile voluntary activity (n = 14 per group). c Food intake (n = 14 per group). d Rectal temperature measured at 22 °C in 5–6-month-old WT (n = 8) and KO mice (n = 9). e Body (n = 10 per group), white adipose tissue (WAT; WT n = 8 and KO n = 7), kidney (WT n = 6 and KO n = 7), spleen (n = 6 per group), tibialis anterior muscle (TA; n = 8 per group), gastrocnemius muscle (GAS; n = 8 per group), soleus muscle (SOL; WT n = 10 and KO n = 9), and quadriceps muscle (QUAD; WT n = 7 and KO n = 6) weight in 12–13-month-old WT and REDD1 KO mice. *p < 0.05, **p < 0.01 and ***p < 0.001 vs. corresponding WT group by unpaired t-test. Black bars are CTRL WT and open bars are CTRL KO. CTRL control, GAS gastrocnemius, KO knockout, mo month, QUAD quadriceps, RER respiratory exchange ratio, SOL soleus, TA tibialis anterior, WAT white adipose tissue, WT wild type
Fig. 7
Fig. 7
REDD1 controls stress-induced reduction in O2 consumption and anabolic processes. In the basal state, activation of the Akt/mTOR pathway promotes (i) anabolic processes (protein and glycogen synthesis), (ii) the mitochondria/ER interaction, and (iii) oxygen-dependent ATP production. In response to energetic stress, REDD1 inhibits the Akt/mTOR pathway and interacts with MAMs, leading to a coordinated decrease in MAMs extent, mitochondrial oxygen consumption, and anabolic processes. This mechanism could contribute to spare ATP in stressful conditions

References

    1. Shoshani T, Faerman A, Mett I, Zelin E, Tenne T, Gorodin S, Moshel Y, Elbaz S, Budanov A, Chajut A, et al. Identification of a novel hypoxia-inducible factor 1-responsive gene, RTP801, involved in apoptosis. Mol Cell Biol. 2002;22(7):2283–2293. doi: 10.1128/MCB.22.7.2283-2293.2002. - DOI - PMC - PubMed
    1. Ellisen LW, Ramsayer KD, Johannessen CM, Yang A, Beppu H, Minda K, Oliner JD, McKeon F, Haber DA. REDD1, a developmentally regulated transcriptional target of p63 and p53, links p63 to regulation of reactive oxygen species. Mol Cell. 2002;10(5):995–1005. doi: 10.1016/S1097-2765(02)00706-2. - DOI - PubMed
    1. Murakami T, Hasegawa K, Yoshinaga M. Rapid induction of REDD1 expression by endurance exercise in rat skeletal muscle. Biochem Biophys Res Commun. 2011;405(4):615–619. doi: 10.1016/j.bbrc.2011.01.078. - DOI - PubMed
    1. Wang Z, Malone MH, Thomenius MJ, Zhong F, Xu F, Distelhorst CW. Dexamethasone-induced gene 2 (dig2) is a novel pro-survival stress gene induced rapidly by diverse apoptotic signals. J Biol Chem. 2003;278(29):27053–27058. doi: 10.1074/jbc.M303723200. - DOI - PubMed
    1. Whitney ML, Jefferson LS, Kimball SR. ATF4 is necessary and sufficient for ER stress-induced upregulation of REDD1 expression. Biochem Biophys Res Commun. 2009;379(2):451–455. doi: 10.1016/j.bbrc.2008.12.079. - DOI - PMC - PubMed

Publication types

Substances