. 2018 Jul 27;293(30):11758-11771.
doi: 10.1074/jbc.RA118.001888. Epub 2018 Jun 12.

The crystal structure of the Helicobacter pylori LlaJI.R1 N-terminal domain provides a model for site-specific DNA binding

Affiliations

The crystal structure of the Helicobacter pylori LlaJI.R1 N-terminal domain provides a model for site-specific DNA binding

Christopher J Hosford et al. J Biol Chem. .

Abstract

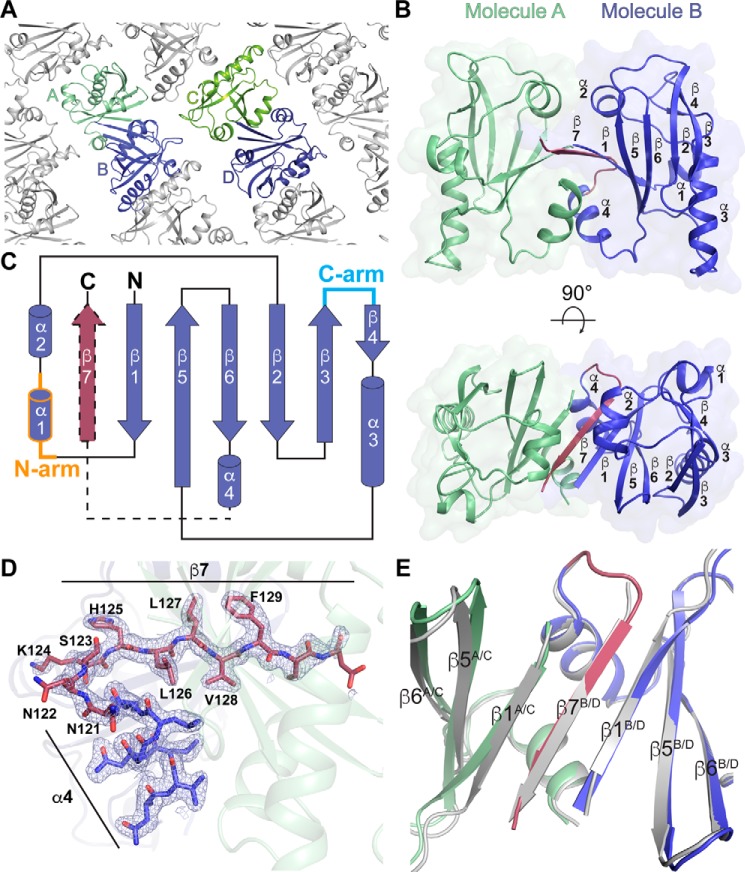
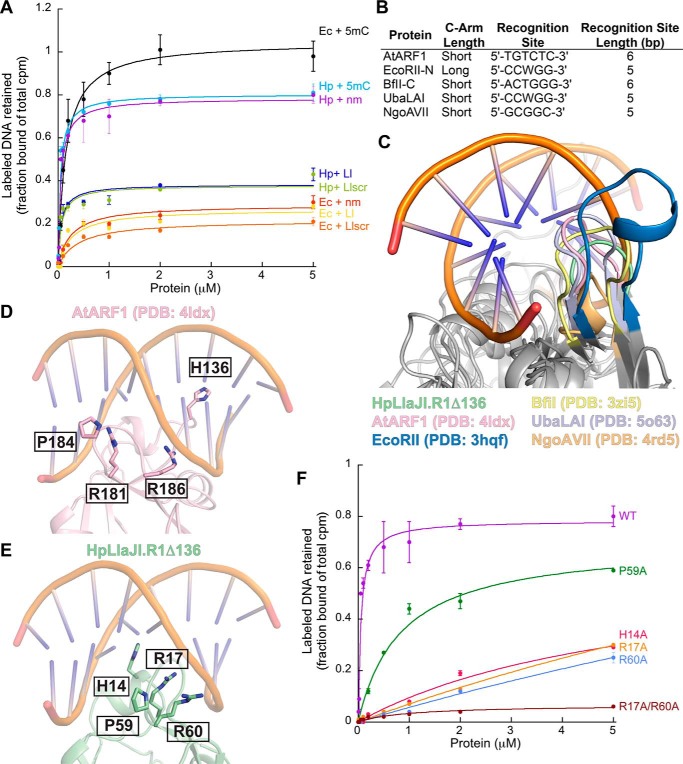
Restriction modification systems consist of an endonuclease that cleaves foreign DNA site-specifically and an associated methyltransferase that protects the corresponding target site in the host genome. Modification-dependent restriction systems, in contrast, specifically recognize and cleave methylated and/or glucosylated DNA. The LlaJI restriction system contains two 5-methylcytosine (5mC) methyltransferases (LlaJI.M1 and LlaJI.M2) and two restriction proteins (LlaJI.R1 and LlaJI.R2). LlaJI.R1 and LlaJI.R2 are homologs of McrB and McrC, respectively, which in Escherichia coli function together as a modification-dependent restriction complex specific for 5mC-containing DNA. Lactococcus lactis LlaJI.R1 binds DNA site-specifically, suggesting that the LlaJI system uses a different mode of substrate recognition. Here we present the structure of the N-terminal DNA-binding domain of Helicobacter pylori LlaJI.R1 at 1.97-Å resolution, which adopts a B3 domain fold. Structural comparison to B3 domains in plant transcription factors and other restriction enzymes identifies key recognition motifs responsible for site-specific DNA binding. Moreover, biochemistry and structural modeling provide a rationale for how H. pylori LlaJI.R1 may bind a target site that differs from the 5-bp sequence recognized by other LlaJI homologs and identify residues critical for this recognition activity. These findings underscore the inherent structural plasticity of B3 domains, allowing recognition of a variety of substrates using the same structural core.

Keywords: DNA binding protein; DNA endonuclease; DNA enzyme; X-ray crystallography; protein structure; restriction system.


Conflict of interest statement

The authors declare that they have no conflicts of interest with the contents of this article

Figures

Figure 1.
Figure 1.
Structure and topology of HpR1Δ136. A, crystal packing of HpR1Δ136. AB and CD dimers are labeled. B, cartoon representations of HpR1Δ136 in two orientations. Molecules A and B are colored green and blue, respectively. The asymmetric β7 strand is colored raspberry. C, topology diagram of HpR1Δ136. The core-fold of each monomer is shown in blue. The relative position and connectivity of the asymmetric β7 strand associated with molecules B and D is denoted by dashed outlines and colored in raspberry. The N- and C-arms are colored orange and cyan, respectively. D, 2Fo − Fc electron density (blue mesh) of the α4–β7 region in molecule B contoured to 1σ. E, superposition of HpR1Δ136 dimers AB and CD. AB dimer is colored green and blue, whereas the CD dimer is colored gray. β7 from molecules B and D are colored raspberry and gray, respectively.
Figure 2.
Figure 2.
Critical structural contacts stabilizing the HpR1Δ136 dimer. A, zoomed view of β1, α2, and β7 interactions at the dimer interface. B, hydrophobic interactions between α4 helices across the dimer interface. C, SEC-MALS analysis indicates HpR1Δ136 exists as a dimer in solution. UV trace (black) and calculated molecular weight based on light scattering (blue) are shown. Dashed red lines denote the predicted molecular weight of an HpR1Δ136 monomer and dimer.
Figure 3.
Figure 3.
SEC-MALS of HpR1Δ136 mutants. V115N is located at the dimer interface (see Fig. 2B), whereas H14A, R17A, P59A, and R60A are putative binding site mutations based on structural homology (see Fig. 6, D and E). UV trace (black) and calculated molecular weight based on light scattering (blue) are shown. Dashed red lines denote the predicted molecular weight of an HpR1Δ136 monomer and dimer.
Figure 4.
Figure 4.
HpR1Δ136 adopts a B3-fold for site-specific DNA recognition. A, superposition of HpR1Δ136 (monomer A, green) with the A. thaliana (At) ARF1 B3 domain (monomer A, pink; PDB code 4ldx) confirms similar structural fold. B, superposition of HpR1Δ136 (light blue) with the AtARF1A B3–DNA complex (gray; PDB code 4ldx) identifies the N-arm (orange and green) and C-arm (cyan and purple) regions that are necessary for target recognition. Structures are oriented looking down the helical axis of bound AtARF1 DNA. C, electrostatic surfaces of the individual HpR1Δ136 and AtARF1 B3 domains. Arrows indicate the N- and C-arms. Scale bar indicates electrostatic surface coloring from −3 KbT/ec to +3 KbT/ec. D, electrostatic surface of the HpR1Δ136 AB dimer in two orientations. N- and C-arms are labeled. The black circle indicates the location of Glu-131 in molecule B.
Figure 5.
Figure 5.
Structural constraints of B3 domain dimerization. Molecule A (green) and molecule B (blue) of HpR1Δ136 are shown in each panel with the asymmetric β7 strand (raspberry) and flanking β1 strands emphasized to delineate the dimer interface. Coordinates from different B3 domains were superimposed with molecule A and the overlapping structural elements that spatially align with the dimer interface are labeled and highlighted. PDB codes are indicated for each structure. A, superposition with EcoRII (gray). B, superposition with BfiI (yellow). C, superposition with VRN1 (cyan). D, superposition with UbaLAI (light blue). E, superposition with AtARF1 (pink). F, superposition with NgoAVII (light orange). G, superposition with RAV1 (magenta). H, superposition with At1g16640.1 (orange).
Figure 6.
Figure 6.
Structural modeling of HpR1Δ136 substrate recognition. A, filter binding analysis of HpR1Δ136 (Hp) and full-length EcMcrB (Ec) interactions with different DNA substrates. Substrate abbreviations are as follows: 5mC, methylated EcMcrB-specific substrate; nm, nonmethylated EcMcrB-specific substrate; Ll, site-specific substrate containing the L. lactis LlaJI.R1 5′-GACGC-3′ target site sequence; Llscr, substrate with the L. lactis LlaJI.R1 target site sequence scrambled as a control. Sequences for each substrate can be found under “Experimental procedures.” Binding was performed at 30 °C for 10 min in a 30-μl reaction mixture containing 14.5 nm unlabeled DNA and 0.5 nm labeled DNA. Samples were filtered through KOH-treated nitrocellulose and binding was assessed by scintillation counting. B, relationship between C-arm length and target site length in previously determined B3 domain–DNA complexes. C, orientation of C-arm loops relative to DNA in various B3 domain homologs. DNA from the AtARF1 complex (PDB code 4ldx) is shown. C-arm coloring is labeled below along with corresponding PDB codes. D, key residues in AtARF1 DNA binding. E, residues predicted to be important for HpR1Δ136 DNA binding based on structural comparison. AtARF1 DNA modeled as in D. F, filter binding analysis of HpR1Δ136 mutants. Point mutations of predicted binding residues identified in D (H14A, red; R17A, orange; P59A, green; R60A, light blue; R17A/R60A; brown) were assessed for binding to the nm DNA substrate. Filter binding was carried out as described in A. The WT curve (purple) is the same as shown in A (Hp+nm).
Figure 7.
Figure 7.
EMSA analysis of predicted HpR1Δ136-binding mutants. Binding was carried out at 25 °C for 30 min in a 16-μl reaction mixture containing 10 ng/μl of digested (BamHI/NdeI) nonmethylated λ-phage DNA, and increasing concentrations (0–100 μm) of each HpR1Δ136 construct. Gels were stained with SYBR® Green in 1× TAE overnight at 25 °C. Calculated sizes (bp) of the digested DNA products are noted on the left of each gel.

Similar articles

Cited by

References

    1. Labrie S. J., Samson J. E., and Moineau S. (2010) Bacteriophage resistance mechanisms. Nat. Rev. Microbiol. 8, 317–327 10.1038/nrmicro2315 - DOI - PubMed
    1. Loenen W. A., Dryden D. T., Raleigh E. A., Wilson G. G., and Murray N. E. (2014) Highlights of the DNA cutters: a short history of the restriction enzymes. Nucleic Acids Res. 42, 3–19 10.1093/nar/gkt990 - DOI - PMC - PubMed
    1. Loenen W. A., Dryden D. T., Raleigh E. A., and Wilson G. G. (2014) Type I restriction enzymes and their relatives. Nucleic Acids Res. 42, 20–44 10.1093/nar/gkt847 - DOI - PMC - PubMed
    1. Pingoud A., Fuxreiter M., Pingoud V., and Wende W. (2005) Type II restriction endonucleases: structure and mechanism. Cell Mol. Life Sci. 62, 685–707 10.1007/s00018-004-4513-1 - DOI - PMC - PubMed
    1. Pingoud A., Wilson G. G., and Wende W. (2014) Type II restriction endonucleases: a historical perspective and more. Nucleic Acids Res. 42, 7489–7527 10.1093/nar/gku447 - DOI - PMC - PubMed

Publication types

MeSH terms

LinkOut - more resources