. 2018 Jun 26;115(26):E6010-E6019.
doi: 10.1073/pnas.1803155115. Epub 2018 Jun 12.

Cancer-mutation network and the number and specificity of driver mutations

Affiliations

Cancer-mutation network and the number and specificity of driver mutations

Jaime Iranzo et al. Proc Natl Acad Sci U S A. .

Abstract

Cancer genomics has produced extensive information on cancer-associated genes, but the number and specificity of cancer-driver mutations remains a matter of debate. We constructed a bipartite network in which 7,665 tumors from 30 cancer types are connected via shared mutations in 198 previously identified cancer genes. We show that about 27% of the tumors can be assigned to statistically supported modules, most of which encompass one or two cancer types. The rest of the tumors belong to a diffuse network component suggesting lower gene specificity of driver mutations. Linear regression of the mutational loads in cancer genes was used to estimate the number of drivers required for the onset of different cancers. The mean number of drivers in known cancer genes is approximately two, with a range of one to five. Cancers that are associated with modules had more drivers than those from the diffuse network component, suggesting that unidentified and/or interchangeable drivers exist in the latter.

Keywords: bipartite networks; cancer types; community detection; driver mutations; passenger mutations.


Conflict of interest statement

The authors declare no conflict of interest.

Figures
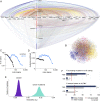
Fig. 1.
Fig. 1.
Structure of the cancer mutation network. (A) Bipartite network of somatic mutations in tumors from the TCGA. Samples are arranged by cancer type along the x axis (black/gray/white bars); cancer genes are sorted by module along the y axis (colors indicate module assignations). Samples from the same cancer type and genes from the same module are sorted by number of connections. The upper and left semiaxes contain genes and samples that belong to statistically significant modules. The rest of the nodes were assigned to the best-match extended module with which they share the highest similarity (see text); they are represented in the lower (genes) and right (samples) semiaxes. Links connect samples and genes affected by at least one nonsynonymous somatic mutation. Links between two nodes from the same module (intramodule links) are drawn in distinctive colors; intermodule links appear in gray. BLCA, bladder urothelial carcinoma; BRCA, breast invasive carcinoma; COAD, colon adenocarcinoma; ESCA, esophageal carcinoma; GBM, glioblastoma multiforme; HNSC, head and neck squamous carcinoma; KIRC, kidney renal clear cell carcinoma; KIRP, kidney renal papillary cell carcinoma; LAML, acute myeloid leukemia; LGG, brain lower-grade glioma; LIHC, liver hepatocellular carcinoma; LUAD, lung adenocarcinoma; LUSC, lung squamous cell carcinoma; OV, ovarian serous cystadenocarcinoma; PAAD, pancreatic adenocarcinoma; PRAD, prostate adenocarcinoma; SARC, sarcoma; SKCM, skin cutaneous melanoma; STAD, stomach adenocarcinoma; THCA, thyroid carcinoma; UCEC, uterine corpus endometrial carcinoma. (B) Alternative representation of the cancer mutation network with a force-directed drawing method. Node colors indicate module assignations. (C) Node degree distribution per sample (black) and per gene (blue). (D) Clustering coefficient of samples (black) and genes (blue) as a function of the node degree (bipartite clustering coefficient calculated as in ref. 67). (E) Modularity of the cancer mutation network, quantified by its Barber’s modularity index (Qb) and compared with 200 random networks with the same degree distribution. The modularity distribution for the original network results from 200 realizations of the community-detection algorithm, each yielding slightly different sets of modules. The lack of overlap reveals a highly significant modular structure (P < 10−20, Welch’s t test). (F) Differences in the functional spectrum of mutations between intramodule and intermodule links (significant modules only). In TSGs, higher percentages of truncating mutations (with respect to all coding mutations) and severe losses [with respect to all copy number variants (CNV)] indicate enrichment in putative drivers. For oncogenes (OG), driver enrichment is associated with lower percentages of truncating mutations and severe losses. *P < 0.05, ***P < 10−5.
Fig. 2.
Fig. 2.
Cancer genes mutated at significantly distinct rates in different modules and cancer types. Tumors that do and do not belong to specificity modules are shown in A and B, respectively. Owing to their “mixed” nature, bladder, prostate, head and neck, and testicular cancers appear twice, with samples assigned to significant modules in A and the rest in B. Only genes that belong to specificity modules are shown. Significance was evaluated with a two-tailed Fisher’s exact test; red and blue indicate that mutations in a gene are over- and underrepresented, respectively, in a group of tumors.
Fig. 3.
Fig. 3.
Classification of cancer types according to the gene specificity of their driver mutations. (A and B) Fraction of samples assigned to statistically significant (solid bars) and best-match extended (semitransparent bars) modules obtained by reassigning nonsignificant samples and genes to the significant modules with which they share the largest number of connections. Black diamonds indicate the fraction of samples assigned to the largest nonsignificant pseudomodule. Cancer types without major contributions to any significant module are shown in B. Bar colors refer to the best-match extended module that contains most samples from each type. (C) Principal component analysis of cancer types based on the fraction of samples assigned to statistically significant modules, best-match extended modules, and the largest nonsignificant pseudomodule. The percentages of the total variance explained by the first and second components are 88.5% and 8.6%, respectively. Special cases discussed in the text are labeled: BLCA, bladder cancer; HNSC, head and neck cancer; OV, ovarian cancer; PRAD, prostate cancer; TGCT, testicular cancer.
Fig. 4.
Fig. 4.
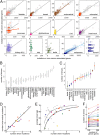
Estimation of the average number of driver mutations per tumor in 198 cancer genes. (A) Regression between the number of coding mutations in cancer genes (y axis) and noncancer genes (x axis). Colored circles correspond to samples from significant modules. The solid lines show the fit to an ANCOVA model with class- or module-specific slopes and intercepts, y=(α+αi)+(β+βi)x+ε, when considering all samples (gray) or samples from significant modules (colored). The global R2 of the model are 0.83 and 0.75, respectively (P < 10−20 in both cases). Vertical and horizontal axes were jointly scaled in all panels to allow comparison of slopes. (B and C) The intercepts that correspond to the estimated number of driver mutations are represented in B (all cancer types) and C (members of significant modules); error bars represent 95% CIs. (D and E) The number of drivers correlates with the number of intramodule mutations (Spearman’s rho = 0.815, P < 0.001) (D) and with the age at diagnosis (Spearman’s rho = 0.527, P = 0.003) (E).The solid line in D is a visual reference that shows the 1:1 correspondence between the number of drivers and the number of intramodule mutations. Solid lines in E are fits to the curve y=aTx/(1+ax) derived from the model of Armitage and Doll (22), where T=75 is the average lifespan in the absence of cancer and a is the proportionality constant between the number of drivers and rate-limiting steps (light gray, a=2.5, all tumors; dark gray, a=1.5, tumors from significant modules). (F) Comparison of the number of driver mutations in the main set of 198 cancer genes and in an extended set of 369 known cancer genes.

References

    1. Stratton MR, Campbell PJ, Futreal PA. The cancer genome. Nature. 2009;458:719–724. - PMC - PubMed
    1. Hanahan D, Weinberg RA. The hallmarks of cancer. Cell. 2000;100:57–70. - PubMed
    1. Martincorena I, Campbell PJ. Somatic mutation in cancer and normal cells. Science. 2015;349:1483–1489. - PubMed
    1. Yates LR, Campbell PJ. Evolution of the cancer genome. Nat Rev Genet. 2012;13:795–806. - PMC - PubMed
    1. Pon JR, Marra MA. Driver and passenger mutations in cancer. Annu Rev Pathol. 2015;10:25–50. - PubMed