

Dual role of USP30 in controlling basal pexophagy and mitophagy
- PMID: 29895712
- PMCID: PMC6030704
- DOI: 10.15252/embr.201745595
Dual role of USP30 in controlling basal pexophagy and mitophagy
Abstract
USP30 is an integral protein of the outer mitochondrial membrane that counteracts PINK1 and Parkin-dependent mitophagy following acute mitochondrial depolarisation. Here, we use two distinct mitophagy reporter systems to reveal tonic suppression by USP30, of a PINK1-dependent component of basal mitophagy in cells lacking detectable Parkin. We propose that USP30 acts upstream of PINK1 through modulation of PINK1-substrate availability and thereby determines the potential for mitophagy initiation. We further show that a fraction of endogenous USP30 is independently targeted to peroxisomes where it regulates basal pexophagy in a PINK1- and Parkin-independent manner. Thus, we reveal a critical role of USP30 in the clearance of the two major sources of ROS in mammalian cells and in the regulation of both a PINK1-dependent and a PINK1-independent selective autophagy pathway.
Keywords: PINK1; USP30; mitochondria; mitophagy; peroxisomes; ubiquitin.
© 2018 The Authors. Published under the terms of the CC BY 4.0 license.
Figures
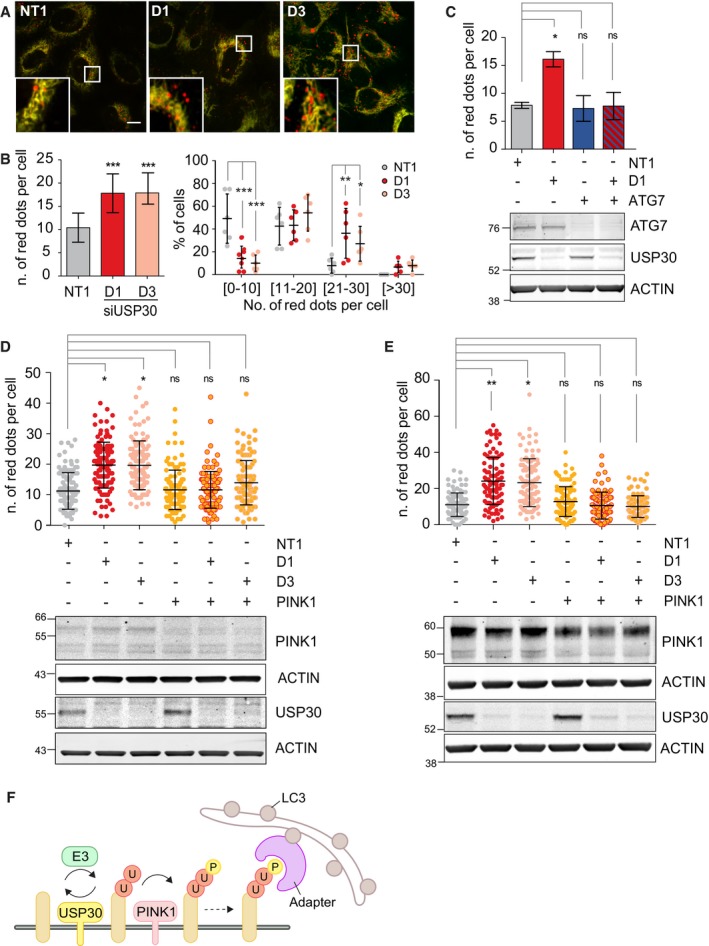
Representative images of U2OS cells stably expressing mCherry‐GFP‐Fis1(101–152) (U2OS‐MGFIS), transfected with non‐targeting (NT1) or USP30 targeting siRNA (D1, D3) for 72 h prior to imaging. Scale bar 10 μm.
Quantification of mitolysosomes (red puncta, “dots”) in U2OS‐MGFIS cells, treated as in (A). Average ± SD; n = 6 independent experiments, 40 cells/experiment; left: one‐way ANOVA and Dunnett's multiple comparison's test, ***P < 0.001; right: two‐way ANOVA and Bonferroni's multiple comparison test, *P < 0.05, **P < 0.01, ***P < 0.001.
Quantification of mitolysosomes in U2OS‐MGFIS cells transfected with siRNAs targeting either USP30 (D1) or ATG7 or both. Average ± SD, n = 3 independent experiments, 40 cells per experiment; one‐way ANOVA and Dunnett's multiple comparison's test, *P < 0.05. Also shown is a representative Western blot.
U2OS‐MGFIS cells were treated with siRNA and analysed as in (B). Average ± SD; n = 3 independent experiments; 40 cells per experiment; one‐way ANOVA and Dunnett's multiple comparison's test, *P < 0.05. Also shown is a representative Western blot.
Quantification of mitolysosomes in hTERT‐RPE1 cells transfected with non‐targeting (NT1) or USP30 (D1, D3) or PINK1 targeting siRNA and mt‐Keima. Average ± SD; n = 3 independent experiments; 40 cells per experiment; one‐way ANOVA and Dunnett's multiple comparison's test, *P < 0.05, **P < 0.01. Also shown is a representative Western blot.
Proposed model: USP30 acts upstream of PINK1 and limits the basal ubiquitylation (U) of outer mitochondrial membrane proteins, which serve as a substrate for PINK1. Phospho (P)‐ubiquitin binds to specialized autophagy adapters (optineurin and NDP52) leading to activation and recruitment of the autophagy machinery including LC3‐decorated autophagic membranes.
- A
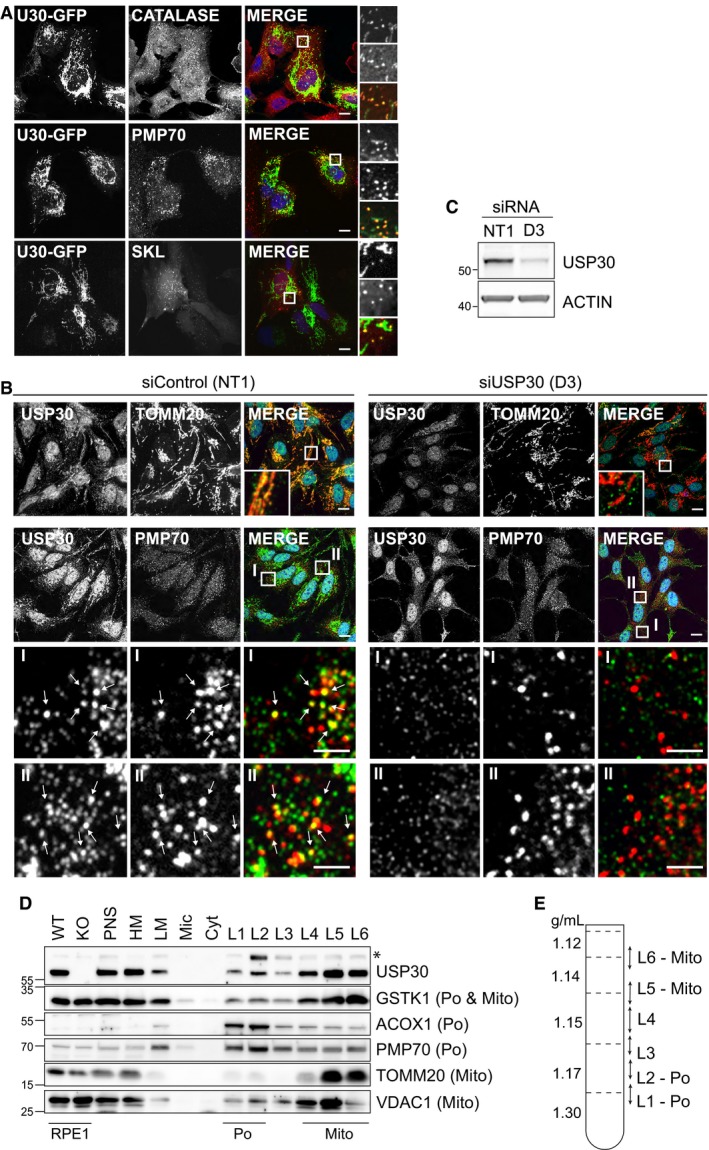
hTERT‐RPE1 cells were transfected with USP30‐GFP for 24 h, then fixed and stained for catalase and PMP70, or cotransfected with mCherry‐SKL and fixed. Scale bars 10 μm.
- B
Representative images of SHSY5Y cells transfected for 144 h with non‐targeting (NT1) or USP30 siRNA (D3), fixed and immunostained for endogenous USP30 (AlexaFluor488; green) and PMP70 (AlexaFluor594; red). Scale bar 10 μm. I and II; enlarged insets with 2.5‐μm scale bars. Arrows highlight individual PMP70‐peroxisomes that stain positive for USP30.
- C
Representative Western blot of cells shown in (B).
- D, E
HepG2 subcellular fractionation and density gradient separation of “light mitochondrial” fractions (LM). USP30 is present in both peroxisomal (L1, L2) and mitochondrial (L5, L6) fractions. HM fractions from wild‐type (WT) and USP30 KO RPE1 cells were loaded alongside the HepG2 fraction for easy identification of the USP30 band. The asterisk marks a non‐specific band retained in USP30 KO cells. ACOX1‐A, acyl CoA oxidase 1 A‐band; GSTK1, glutathione‐S‐transferase κ‐1; VDAC1, voltage‐dependent anion‐selective channel protein 1; Po, peroxisome marker, Mito, mitochondria marker; PNS, post‐nuclear supernatant; HM, heavy mitochondria fraction; Mic, microsome fraction; Cyt, cytosolic fraction; L1‐L6, LM gradient fractions.
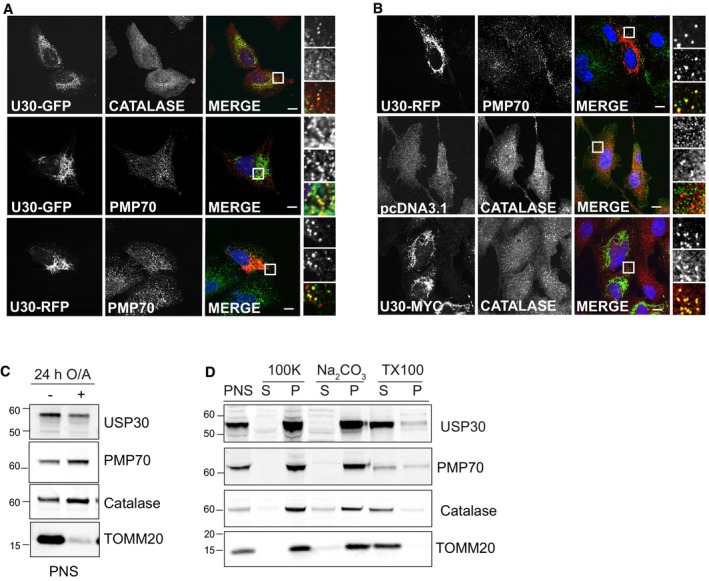
U2OS cells were transfected with pEGFP‐N3‐USP30 or pRFP‐N3‐USP30 for 24 h, fixed and stained for the peroxisomal proteins, catalase and PMP70.
hTERT‐RPE1 cells were transfected with pRFP‐N3‐USP30, pCMV6‐myc‐DDK‐mUSP30 (Origene) or pCDNA‐3.1 for 24 h, fixed and stained for Myc or the peroxisomal proteins PMP70 and catalase. Scale bars (A, B) 10 μm.
hTERT‐RPE1 YFP‐Parkin cells were either left untreated or treated for 24 h with oligomycin A (1 μM) and antimycin A (1 μM). A post‐nuclear supernatant (PNS) was obtained and analysed by SDS–PAGE to assess mitochondrial and peroxisomal protein levels. Representative experiment (n = 2).
A membrane pellet obtained from untreated hTERT‐RPE1 YFP‐Parkin cells was incubated with 0.1 M alkaline Na2CO3 or 2% Triton X‐100 and 1 M NaCl, then subjected to ultracentrifugation. Supernatants and pellets were analysed by SDS–PAGE. Representative experiment (n = 2).
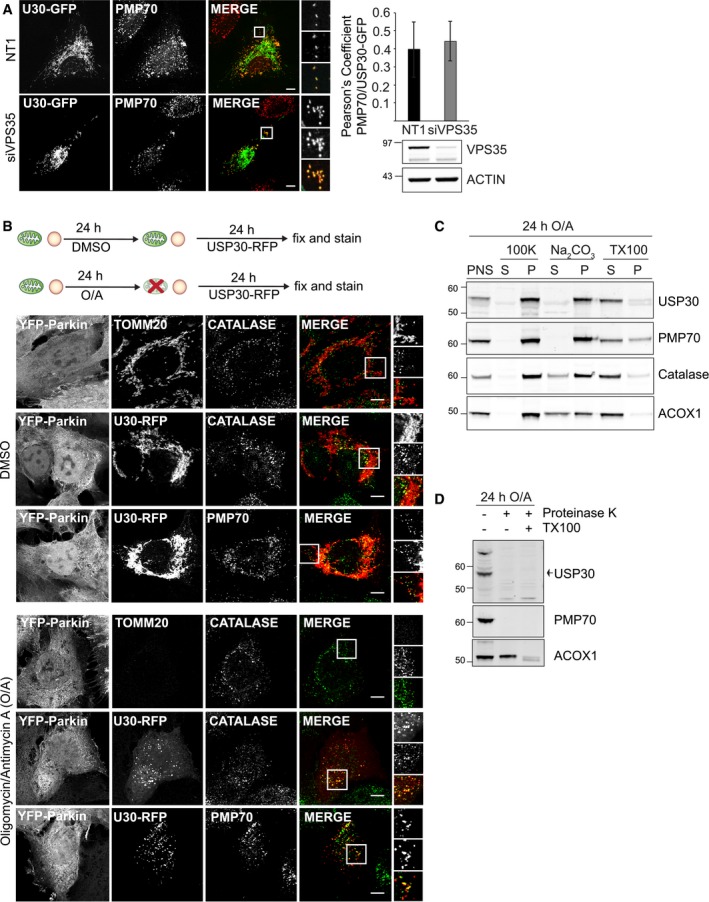
hTERT‐RPE1 cells were transfected with non‐targeting (NT1) or VPS35 siRNA for 120 h, then transfected with USP30‐GFP for 24 h and subsequently stained for PMP70. Shown are representative images and Pearson's correlation coefficients (full z‐stack, mean ± SD, n = 10 cells). Scale bars 10 μm.
hTERT‐RPE1 YFP‐Parkin cells were first treated for 24 h with oligomycin A (1 μM) and antimycin A (1 μM) or DMSO, then transfected with USP30‐RFP and fixed 24 h post‐transfection. Cells were stained for catalase or PMP70 (AlexaFluor350, green) alone. A set of untransfected cells treated in parallel were co‐stained for TOMM20 (AlexaFluor555, red). Scale bars: 10 μm.
Peroxisomal USP30 is an integral membrane protein. Membrane fractions derived from hTERT‐RPE1 YFP‐Parkin cells, treated for 24 h with oligomycin A (1 μM) and antimycin A (1 μM), were extracted either with 0.1 M alkaline Na2CO3 or 2% Triton X‐100 and 1 M NaCl, and supernatants and pellets were analysed by SDS–PAGE and immunoblot. Representative experiment (n = 2).
Topology of peroxisomal USP30. A post‐nuclear supernatant, derived from hTERT‐RPE1 YFP‐Parkin cells treated for 24 h with oligomycin A (1 μM) and antimycin A (1 μM), was incubated with proteinase K in the presence or absence of 1% Triton X‐100 for 30 min at 4°C, then analysed by SDS–PAGE and immunoblot. Representative experiment (n = 2).
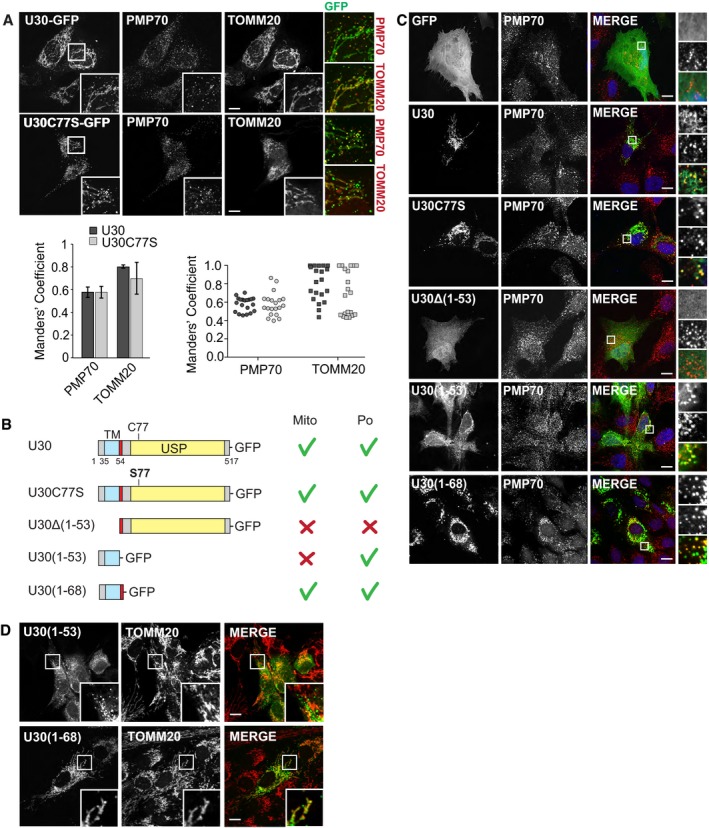
hTERT‐RPE1 cells were transfected with USP30‐GFP and inactive USP30‐C77S‐GFP, fixed and co‐stained for PMP70 (AlexaFluor555) and TOMM20 (AlexaFluor633). Representative images and quantification. Left graph: Manders’ coefficients between USP30 (U30) or USP30‐C77S (U30C77S) and PMP70 or TOMM20 derived from z‐stacks (average of two independent experiments, ± range). The right hand graph shows all data points.
Schematic representation of the USP30 mutants and respective localisation. The transmembrane domain (TM) is indicated in light blue, the catalytic domain (USP) in yellow and the polybasic stretch in red.
hTERT‐RPE1 cells were transfected with USP30‐GFP, USP30‐C77S‐GFP, USP30Δ(1‐53)‐GFP, USP30(1‐53)‐GFP and USP30(1‐68)‐GFP, fixed and stained for PMP70 (AlexFluor594, red).
hTERT‐RPE1 cells were transfected with USP30(1‐53)‐GFP and USP30(1‐68)‐GFP, fixed and stained for TOMM20 (AlexaFluor594, red). Scale bars (A, C, D) 10 μm.
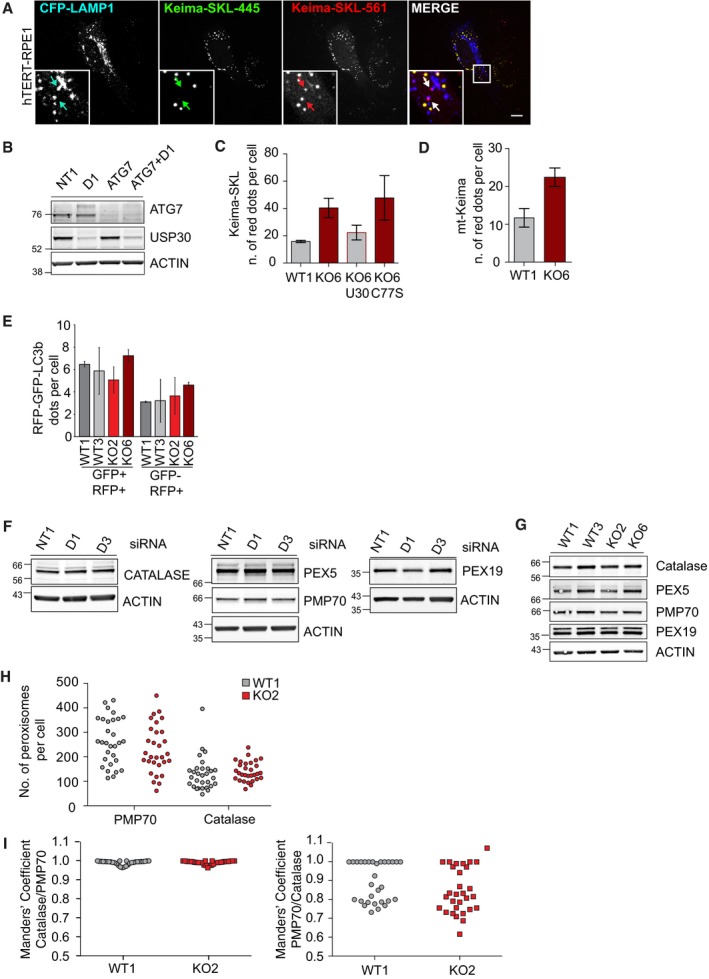
Representative images of hTERT‐RPE1 cells transfected with Keima‐SKL and CFP‐LAMP1 for 48 h, fixed and analysed by 3i‐spinning disk confocal microscopy. Scale bar: 10 μm. Arrows indicate Keima‐SKL “red” puncta that colocalise with the lysosomal marker CFP‐LAMP1.
Representative Western blot of cells analysed in Fig 5B.
Keima‐SKL “red” puncta in USP30 KO or WT hTERT‐RPE1 cells. Keima‐SKL was either transfected on its own or together with USP30‐GFP and USP30C77S‐GFP for 48 h. Two independent experiments were analysed, 20 cells per experiment, mean ± range.
Quantification of the percentage of mt‐Keima “red” puncta in USP30 KO6 or WT1 hTERT‐RPE1 cells (n = 2 independent experiments, 20 cells per experiment, mean ± range).
hTERT‐RPE1 USP30 WT and KO cells (WT1, WT3, KO2 and KO6) were transfected with RFP‐GFP‐LC3b for 48 h prior to imaging by 3i‐spinning disk confocal microscopy. Shown are representative images and the numbers of RFP‐GFP‐LC3b puncta per cell as an assessment of basal autophagic flux. Two independent experiments were analysed, 20 cells per experiment, mean ± range.
hTERT‐RPE1 cells were transfected with non‐targeting (NT1) or USP30 targeting siRNA (D1 and D3) for 72 h and lysed in RIPA buffer. Protein samples were analysed by SDS–PAGE and Western blots probed for catalase, PMP70, PEX5 and PEX19.
hTERT‐RPE1 USP30 WT and KO cells (WT1, WT3, KO2 and KO6) were lysed in RIPA buffer and analysed by SDS–PAGE and Western blots probed for catalase, PMP70, PEX5 and PEX19.
Quantification of the number of peroxisomes of hTERT‐RPE1 USP30 WT and KO cells (WT1 and KO2), fixed and stained for PMP70 (AlexaFluor488) and catalase (AlexaFluor594). Graph shows the data from three independent experiments in which 10 cells per experiment were analysed.
Colocalisation analysis of hTERT‐RPE1 USP30 WT and KO cells, fixed and stained for the peroxisomal protein PMP70 (AlexaFluor488) and catalase (AlexaFluor594). Graphs show Manders’ coefficients between catalase and PMP70 or PMP70 and catalase derived from z‐stacks of 10 cells per experiment (n = 3 independent experiments, 10 cells per experiment). Note that PMP70 is a component of both immature and mature peroxisomes whereas catalase is associated only with import‐competent peroxisomes. Scale bars 10 μm.
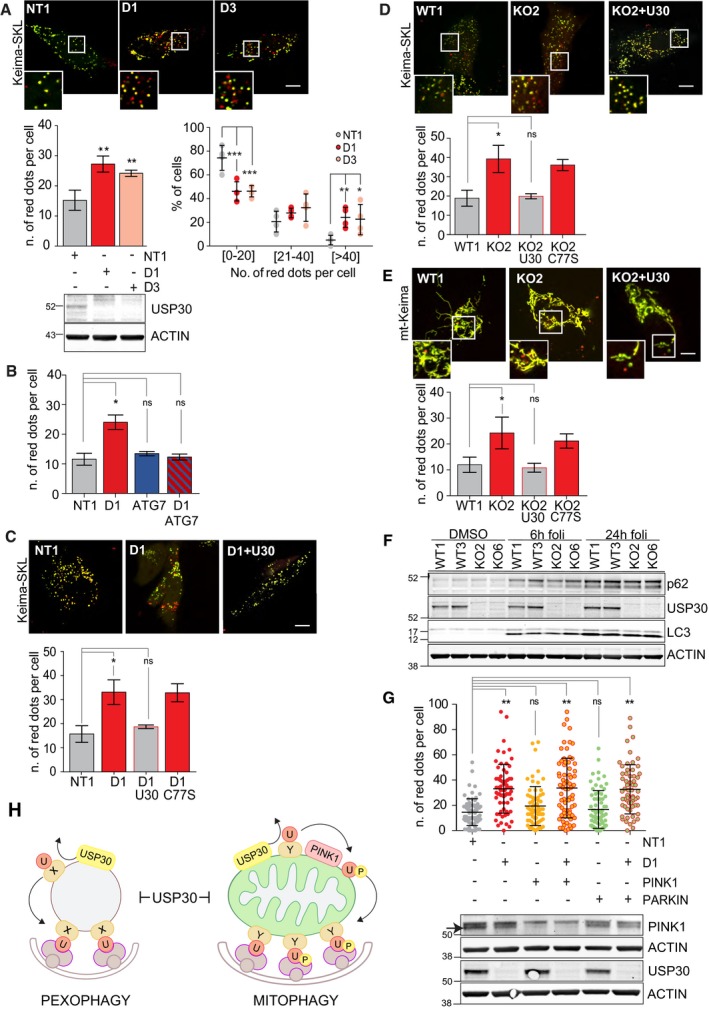
Representative images of hTERT‐RPE1 cells treated with non‐targeting (NT1) or USP30 siRNA oligos (D1, D3). After 24 h, cells were transfected with Keima‐SKL and imaged 48 h later. Graphs show the quantification of Keima‐SKL “red” puncta (dots) per cell. Average ± SD, n = 4 independent experiments, 40 cells per experiment. Left: one‐way ANOVA and Dunnett's multiple comparison's test, **P < 0.01; right: two‐way ANOVA and Bonferroni's multiple comparison test, ***P < 0.001, **P < 0.01, *P < 0.05.
Quantification of Keima‐SKL as in (A) for hTERT‐RPE1 cells treated with siRNA targeting USP30 (D1), ATG7 or both. Average ± SD, n = 3 independent experiments, 40 cells per experiment; one‐way ANOVA and Dunnett's multiple comparison's test, *P < 0.05.
Representative images of hTERT‐RPE1 cells treated as in (A) except Keima‐SKL was cotransfected with siRNA‐resistant USP30‐GFP (U30) and USP30C77S‐GFP (C77S). Three independent experiments were analysed for the first three conditions, two of which also included the C77S rescue. Graph shows the average ± SD or range; 20 cells per experiment. One‐way ANOVA and Dunnett's multiple comparison's test, *P < 0.05.
Representative images of Keima‐SKL “red” puncta in USP30 KO or WT hTERT‐RPE1 cells. Keima‐SKL was either transfected on its own or together with USP30‐GFP and USP30C77S‐GFP for 48 h. Three independent experiments were analysed for the first three conditions, of which two experiments also included the C77S rescue. Graph shows the average ± SD or range; 20 cells per experiment. One‐way ANOVA and Dunnett's multiple comparison's test, **P < 0.01.
Representative images of mt‐Keima “red”‐puncta in USP30 KO and WT hTERT‐RPE1 clones, transfected on its own or together with USP30‐GFP and USP30C77S‐GFP for 48 h with mt‐Keima. Graph shows the average from three independent experiments ± SD; 20 cells per experiment. One‐way ANOVA, *P < 0.05.
hTERT‐RPE1 USP30 WT and KO cells (each two independent clones) were treated for 6 or 24 h with 100 nM folimycin or DMSO as a control. Lysates were separated by SDS–page and analysed by Western blot as indicated.
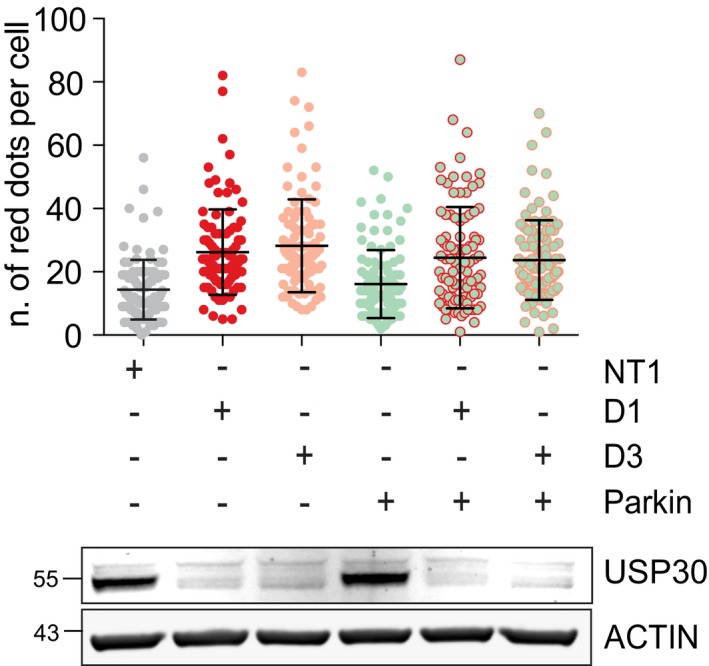
Quantification of Keima‐SKL “red” puncta in hTERT‐RPE1 cells transfected with siRNA targeting USP30 (D1), PINK1 and PARKIN or non‐targeting oligos (NT1). After 24 h, cells were transfected with the Keima‐SKL for another 48 h prior to image capture. Average ± SD, n = 3 independent experiments; 20 cells per experiment. One‐way ANOVA and Dunnett's multiple comparison's test, **P < 0.01, overlaid on top of the data points.
Summary illustration: USP30 opposes both basal pexophagy‐ and PINK1‐dependent basal mitophagy. Scale bars (A, C, D, E) 10 μm.
Comment in
-
Organelle Turnover: A USP30 Safety Catch Restrains the Trigger for Mitophagy and Pexophagy.Curr Biol. 2018 Aug 6;28(15):R842-R845. doi: 10.1016/j.cub.2018.06.067. Curr Biol. 2018. PMID: 30086320
References
-
- Bingol B, Sheng M (2016) Mechanisms of mitophagy: PINK1, parkin, USP30 and beyond. Free Radic Biol Med 100: 210–222 - PubMed
Publication types
MeSH terms
Substances
Grants and funding
LinkOut - more resources
Full Text Sources
Other Literature Sources
Research Materials
