Overexpression of BraLTP2, a Lipid Transfer Protein of Brassica napus, Results in Increased Trichome Density and Altered Concentration of Secondary Metabolites
- PMID: 29895724
- PMCID: PMC6032385
- DOI: 10.3390/ijms19061733
Overexpression of BraLTP2, a Lipid Transfer Protein of Brassica napus, Results in Increased Trichome Density and Altered Concentration of Secondary Metabolites
Abstract
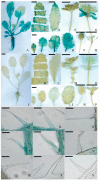
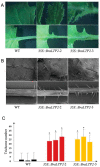
Plant non-specific lipid transfer proteins (nsLTPs) belong to a large multigene family that possesses complex physiological functions. Trichomes are present on the aerial surfaces of most plants and include both glandular secretory hairs and non-glandular hairs. In this study, BraLTP2 was isolated from Brassica rapa (B. rapa) and its function was characterized in the important oilseed crop Brassica napus (B. napus). B. rapa lipid transfer protein 2 (BraLTP2) belongs to the little-known Y class of nsLTPs and encodes a predicted secretory protein. In ProBraLTP2::GUS (β-glucuronidase) transgenic plants, strong GUS activity was observed in young leaves and roots, while low activity was observed in the anther. It is noteworthy that strong GUS activity was observed in trichomes of the first four leaves of 4-week-old and 8-week-old seedings, however, it disappeared in 12-week-old seedings. In transgenic plants expressing a BraLTP2::GFP (green fluorescent protein) fusion protein, GFP fluorescence localized in the extracellular space of epidermal cells and trichomes. Overexpression of BraLTP2 in B. napus caused an increase in trichome number and altered the accumulation of secondary metabolites in leaves, including 43 upregulated secondary metabolites. Moreover, transgenic plants showed significantly increased activities of antioxidant enzymes. These results suggest that BraLTP2, a new nsLTP gene, may play a role in trichome development and the accumulation of secondary metabolites.
Keywords: BraLTP2; Brassica napus; antioxidant enzymes; overexpression; secondary metabolites; trichome development.
Conflict of interest statement
The authors declare no conflict of interest.
Figures


Similar articles
-
Hairy Canola (Brasssica napus) re-visited: Down-regulating TTG1 in an AtGL3-enhanced hairy leaf background improves growth, leaf trichome coverage, and metabolite gene expression diversity.BMC Plant Biol. 2016 Jan 6;16:12. doi: 10.1186/s12870-015-0680-5. BMC Plant Biol. 2016. PMID: 26739276 Free PMC article.
-
Tobacco NtLTP1, a glandular-specific lipid transfer protein, is required for lipid secretion from glandular trichomes.Plant J. 2012 May;70(3):480-91. doi: 10.1111/j.1365-313X.2011.04886.x. Epub 2012 Feb 6. Plant J. 2012. PMID: 22171964
-
Expression of Brassica napus TTG2, a regulator of trichome development, increases plant sensitivity to salt stress by suppressing the expression of auxin biosynthesis genes.J Exp Bot. 2015 Sep;66(19):5821-36. doi: 10.1093/jxb/erv287. Epub 2015 Jun 12. J Exp Bot. 2015. PMID: 26071533 Free PMC article.
-
Rapeseed species and environmental concerns related to loss of seeds of genetically modified oilseed rape in Japan.GM Crops. 2010 May-Jun;1(3):143-56. doi: 10.4161/gmcr.1.3.12761. GM Crops. 2010. PMID: 21844669 Review.
-
The Flavonoid Biosynthesis and Regulation in Brassica napus: A Review.Int J Mol Sci. 2022 Dec 26;24(1):357. doi: 10.3390/ijms24010357. Int J Mol Sci. 2022. PMID: 36613800 Free PMC article. Review.
Cited by
-
Comparative translational reprogramming of Glycine max during mechanical wounding.Physiol Mol Biol Plants. 2025 Feb;31(2):263-282. doi: 10.1007/s12298-025-01562-w. Epub 2025 Feb 27. Physiol Mol Biol Plants. 2025. PMID: 40070533
-
Study of micro-trichome (mict) reveals novel connections between transcriptional regulation of multicellular trichome development and specific metabolism in cucumber.Hortic Res. 2021 Feb 1;8(1):21. doi: 10.1038/s41438-020-00456-0. Hortic Res. 2021. PMID: 33518711 Free PMC article.
-
Transcriptome-Wide Identification and Expression Analysis of Genes Encoding Defense-Related Peptides of Filipendula ulmaria in Response to Bipolaris sorokiniana Infection.J Fungi (Basel). 2024 Mar 28;10(4):258. doi: 10.3390/jof10040258. J Fungi (Basel). 2024. PMID: 38667929 Free PMC article.
-
Characterization of non-specific lipid transfer protein (nsLtp) gene families in the Brassica napus pangenome reveals abundance variation.BMC Plant Biol. 2022 Jan 7;22(1):21. doi: 10.1186/s12870-021-03408-5. BMC Plant Biol. 2022. PMID: 34996379 Free PMC article.
-
Transgenesis as a Tool for the Efficient Production of Selected Secondary Metabolites from in Vitro Plant Cultures.Plants (Basel). 2020 Jan 21;9(2):132. doi: 10.3390/plants9020132. Plants (Basel). 2020. PMID: 31973076 Free PMC article. Review.
References
-
- Werker E. Trichome diversity and development. Adv. Bot. Res. 2000;31:1–35.
-
- Fordyce J.A., Agrawal A.A. The Role of Plant Trichomes and Caterpillar Group Size on Growth and Defence of the Pipevine Swallowtail Battus philenor. J. Anim. Ecol. 2001;70:997–1005. doi: 10.1046/j.0021-8790.2001.00568.x. - DOI
-
- Voirin B., Bayet C., Colson M. Demonstration that flavone aglycones accumulate in the peltate glands of Mentha x piperita leaves. Phytochemistry. 1993;34:85–87. doi: 10.1016/S0031-9422(00)90787-8. - DOI
MeSH terms
Substances
LinkOut - more resources
Full Text Sources
Other Literature Sources

