. 2018 Jun 12;9(1):2292.
doi: 10.1038/s41467-018-04602-0.

Oxidized phospholipids regulate amino acid metabolism through MTHFD2 to facilitate nucleotide release in endothelial cells

Affiliations

Oxidized phospholipids regulate amino acid metabolism through MTHFD2 to facilitate nucleotide release in endothelial cells

Juliane Hitzel et al. Nat Commun. .

Abstract

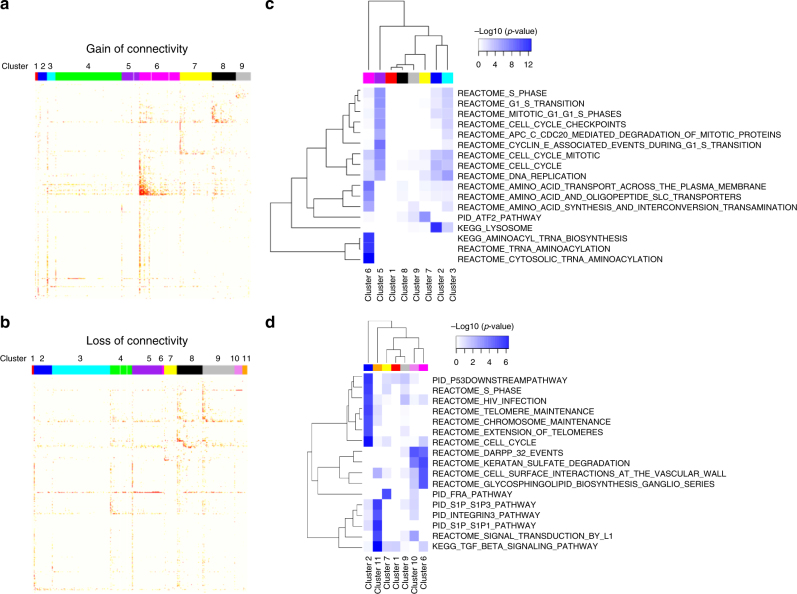
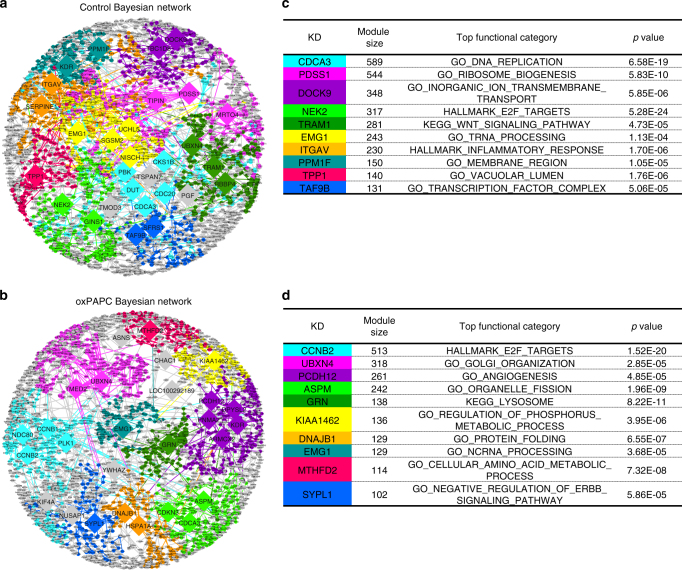
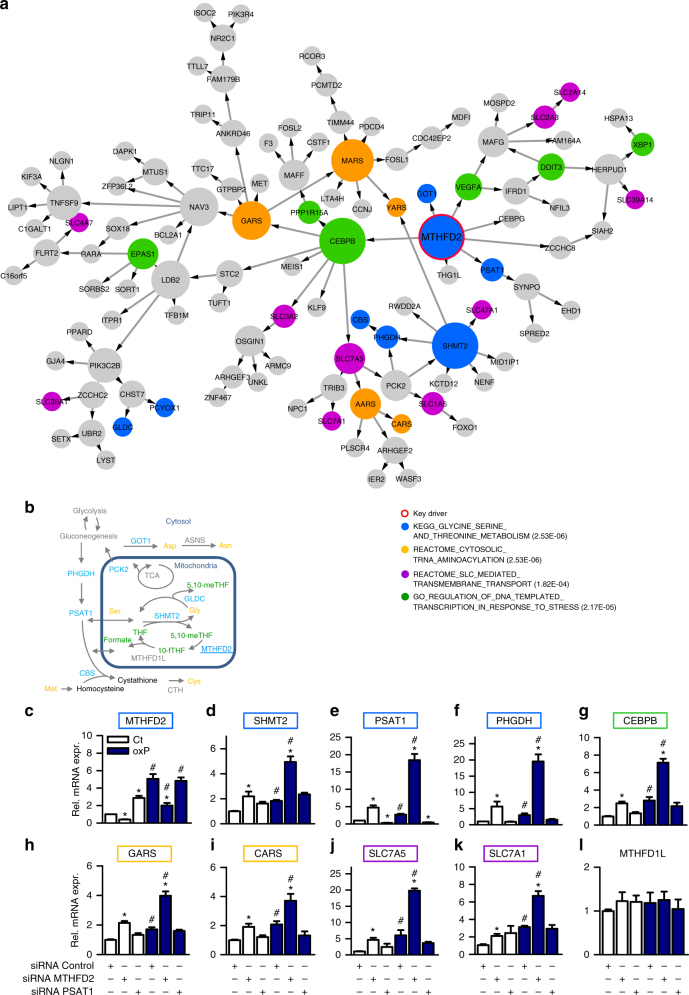
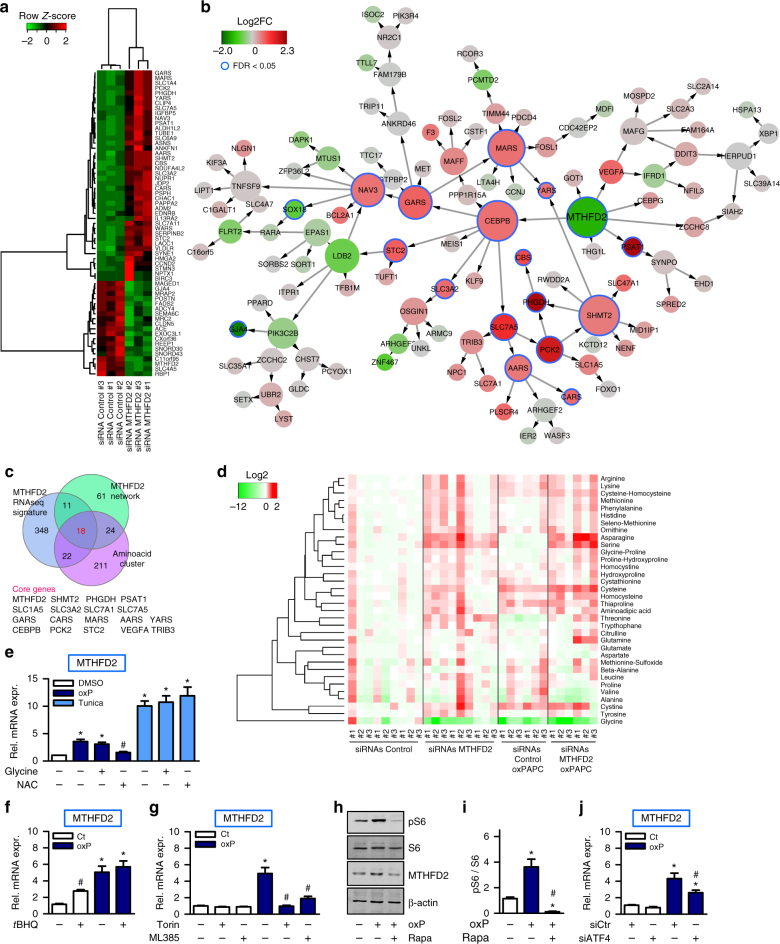
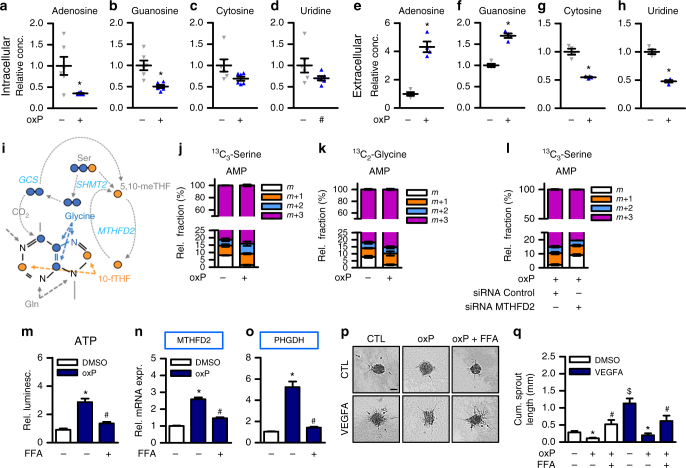
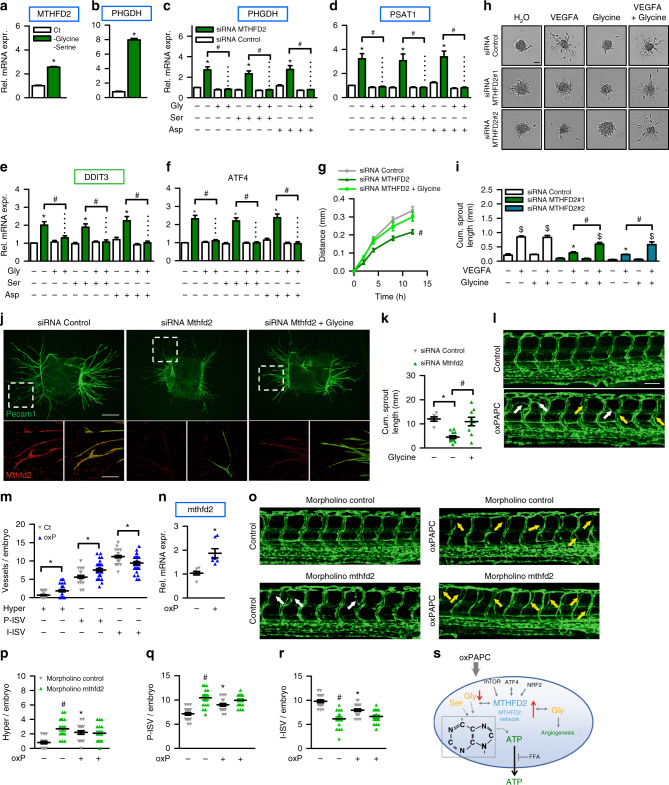
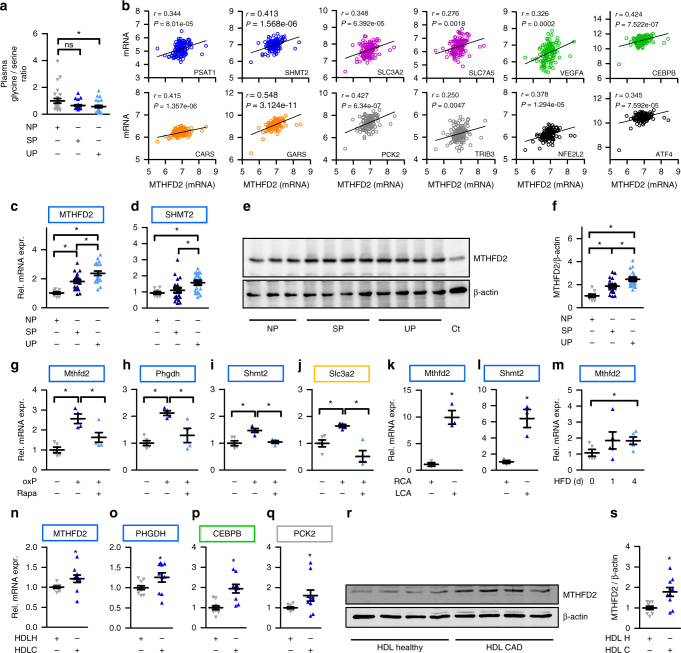
Oxidized phospholipids (oxPAPC) induce endothelial dysfunction and atherosclerosis. Here we show that oxPAPC induce a gene network regulating serine-glycine metabolism with the mitochondrial methylenetetrahydrofolate dehydrogenase/cyclohydrolase (MTHFD2) as a causal regulator using integrative network modeling and Bayesian network analysis in human aortic endothelial cells. The cluster is activated in human plaque material and by atherogenic lipoproteins isolated from plasma of patients with coronary artery disease (CAD). Single nucleotide polymorphisms (SNPs) within the MTHFD2-controlled cluster associate with CAD. The MTHFD2-controlled cluster redirects metabolism to glycine synthesis to replenish purine nucleotides. Since endothelial cells secrete purines in response to oxPAPC, the MTHFD2-controlled response maintains endothelial ATP. Accordingly, MTHFD2-dependent glycine synthesis is a prerequisite for angiogenesis. Thus, we propose that endothelial cells undergo MTHFD2-mediated reprogramming toward serine-glycine and mitochondrial one-carbon metabolism to compensate for the loss of ATP in response to oxPAPC during atherosclerosis.


Conflict of interest statement

The authors declare no competing interests.

Figures

Fig. 1
Fig. 1
Differential connectivity clusters of HAEC reveal the emergence of novel gene clusters in response to oxidized phospholipids. a, b Topological overlap matrix of nine clusters with significant gain of connectivity (a) and 11 clusters with significant loss of connectivity (b) identified in a comparison of genome-wide gene−gene co-expression relationships between oxPAPC treated and control HAEC. c, d Heatmap of significantly overrepresented canonical pathways of gain of connectivity clusters (c) without cluster 4 (Supplementary Table 1) and loss of connectivity clusters (d) without clusters 3–5 and 8 (Supplementary Table 2) according to Fisher’s exact test are shown
Fig. 2
Fig. 2
Bayesian networks of HAEC reveal novel key drivers in response to oxidized phospholipids. a, b Network view of HAEC Bayesian network of control state (a) and oxPAPC-treated state (b). Key drivers with more than 100 downstream nodes are indicated and ten top-ranked subnetworks according to strength of enrichment and subnetwork size are colored. Edges are colored according to source node. c, d List of ten subnetworks colored within control (c) and oxPAPC (d) Bayesian network with most top key driver, number of nodes, most significant overrepresented functional category and p value are listed
Fig. 3
Fig. 3
Key driver MTHFD2 and oxPAPC induce endothelial Bayesian amino acid subnetwork. a Network view of the oxPAPC Bayesian subnetwork with MTHFD2 as key driver. Nodes that belong to indicated significantly overrepresented canonical gene set categories are highlighted respectively. Node size reflects out-degree. b Schematic diagram of enzymes within the MTHFD2 network (blue) that are directly or indirectly involved in serine, glycine, cysteine, methionine, aspartate, and asparagine (orange) interconversion as well as interconversion of tetrahydrofolates (THF) inside mitochondria (green). CBS: Cystathionine-Beta-Synthase, PCK2: Phosphoenolpyruvate Carboxykinase 2, GOT1 Glutamic-Oxaloacetic Transaminase 1, GLDC: Glycine Decarboxylase, ASNS: Asparagine Synthetase. c−l Experimental validation of the MTHFD2 network as assessed by quantitative RT-PCR. HAEC with and without knockdown of the key driver MTHFD2 or the downstream node PSAT1 were exposed to medium (1% FCS) with (oxP) or without (Ct) oxPAPC for 4 h (n ≥ 4). Genes belonging to the MTHFD2 network are framed by the color of the corresponding gene set category as in a. Data are represented as mean ± SEM, *p ≤ 0.05 (MTHFD2 or PSAT1 vs Control siRNA), #p ≤ 0.05 (oxP vs Ct) (ANOVA with Bonferroni post-hoc test). MTHFD2: Methylenetetrahydrofolate Dehydrogenase (NADP + Dependent) 2-Methenyltetrahydrofolate Cyclohydrolase, SHMT2: serine hydroxymethyltransferase 2, PHGDH: phosphoglycerate dehydrogenase, PSAT1: phosphoserine aminotransferase 1, CEBPB: CCAAT/Enhancer Binding Protein Beta, GARS: Glycyl-TRNA Synthetase, CARS Cysteinyl-TRNA Synthetase, SLC7A5: Solute Carrier Family 7 Member 5, SLC7A1: Solute Carrier Family Member 1, MTHFD1L: Methylenetetrahydrofolate Dehydrogenase (NADP + Dependent) 1-Like
Fig. 4
Fig. 4
Knockdown of MTHFD2 and oxPAPC drains the intracellular glycine pool. a Heatmap for fragments per kilobase of transcript per million mapped reads (FPKM) of significantly differentially expressed genes (FDR < 0.01, Benjamini−Hochberg). RNAseq was performed in HAEC with three different siRNAs against MTHFD2 or scrambled control. b Projection of RNAseq signature (FDR < 0.01, Benjamini−Hochberg) in a onto the MTHFD2 network. Direction of expression of nodes of the MTHFD2 network in RNAseq signature is indicated by the node color. Node size reflects out-degree. c Venn diagram of genes in the amino acid cluster, MTHFD2 network and MTHFD2 RNAseq signature (FDR < 0.01, Benjamini−Hochberg). Genes belonging to all three gene sets are listed. d Heatmap of amino acid profile. HAEC were treated with three different siRNAs against MTHFD2 or scrambled control and exposed to medium (1% FCS) with or without oxPAPC for 4 h. Amino acids in cell lysates were measured by mass spectrometry (n = 6–9). e Relative mRNA expression of MTHFD2 in HAEC pretreated with N-acetylcysteine (NAC) (5 mM) and glycine (500 µM) for 1 h and then exposed to medium (1% FCS) with (oxP) or without (Ct) oxPAPC or tunicamycin (10 µg ml−1) for 4 h (n = 5). f qRT-PCR detection of MTHFD2 in HAEC exposed to medium (1% FCS) with or without oxPAPC and treated with tBHQ (20 µM) or DMSO as control for 24 h (n = 4). g HAEC were exposed to medium (1% FCS) with or without oxPAPC and additionally treated with torin (100 nM), ML385 (10 µM) or DMSO as control (n = 4). h, i Western blot detection (h) and quantification (i) of phosphorylated S6, S6 and MTHFD2 in HAEC pretreated with rapamycin (20 nM) or DMSO as control overnight and exposed to medium (1% FCS) with or without oxPAPC for 4 h (n = 4). j HAEC were treated with scrambled control siRNA (siCtr) or siRNA against ATF4 and exposed to oxPAPC or control medium for 4 h (n = 5). Data are represented as mean ± SEM, *p ≤ 0.05 (oxP or tunicamycin vs Ct), #p ≤ 0.05 (inhibitor present vs absent or ATF4 vs Control siRNA) (ANOVA with Bonferroni post-hoc test)
Fig. 5
Fig. 5
OxPAPC elicits ATP release and inhibition of ATP release prevents induction of MTHFD2. a−d Nucleoside measurement in HAEC exposed to medium (1% FCS) with (oxP) or without (Ct) oxPAPC for 24 h. Cell lysates were measured by mass spectrometry (n = 6). (*p ≤ 0.05 Student’s t test). e−h Nucleoside measurement in supernatants of HAEC exposed to medium (1% FCS) with or without oxPAPC for 24 h. Supernatants were measured by mass spectrometry (n = 4) (*p ≤ 0.05 Student’s t-test) i Scheme of flow of serine- and glycine-derived carbons which can be incorporated into the purine backbone. j, k HAEC were treated with 13C3-serine (j) or 13C2-glycine (k) and oxPAPC or control for 24 h and supernatants were measured by mass spectrometry (n = 3). Relative fractions of extracellular AMP containing no (m), one (m + 1), two (m + 2) or three (m + 3) heavy carbons are shown. l 24 h flux analysis with 13C3-serine labeling in HAEC with or without siRNA mediated knockdown of MTHFD2 (n = 3). m ATP measurement of supernatants of HAEC exposed to medium (1% FCS) with or without oxPAPC and flufenamic acid (FFA, 50 µM) for 8 h. ATP was measured by luminescence and normalized to intracellular RNA concentration (n = 7). n, o qRT-PCR detection of MTHFD2 and PHGDH in HAEC exposed to medium (1% FCS) with or without oxPAPC and flufenamic acid (FFA, 50 µM) for 24 h (n = 5). p, q Spheroid outgrowth assay (p) and quantification (q) of the cumulative sprout length of HUVEC treated with combinations of oxPAPC, flufenamic acid (FFA, 50 µM) and VEGF-A165 (10 ng ml−1) as indicated (n = 6). Scale bar: 50 µM. Data are represented as mean ± SEM, *p ≤ 0.05 (oxP vs Ct), #p ≤ 0.05 (inhibitor present vs absent), $p ≤ 0.05 (VEGFA vs Ct), (ANOVA with Bonferroni post-hoc test if not otherwise indicated)
Fig. 6
Fig. 6
MTHFD2-dependent glycine is crucial for angiogenesis. a, b qRT-PCR detection of MTHFD2 and PHGDH in HAEC treated with (Ct) or without serine (300 µM) and glycine (30 µM) for 16 h (n = 4). (*p ≤ 0.05 Student’s t test) c−f HUVEC treated with the indicated siRNAs were supplemented with or without glycine, serine or asparagine (500 µM) for 16 h (n = 8). DDIT3 DNA damage inducible transcript 3 (also known as CHOP). g Scratch wound migration assay of HUVEC treated with the indicated siRNAs and supplemented with or without glycine (500 µM). Migration distance after application of scratch is depicted (n = 5). (ANOVA with repeated measures) h, i Spheroid outgrowth assay (h) and quantification of the cumulative sprout length (i) of HUVEC treated with or without the siRNAs indicated and VEGF-A165 (10 ng ml−1) or glycine (500 µM) (n = 6). Scale bar: 50 µM. j, k Immunofluorescence (j) and quantification of cumulative sprout length (k) of aortic ring outgrowth in organ culture treated with the indicated siRNAs and glycine (500 µM) (n = 6–12). Pecam1 was used as a marker for endothelial cells. Scale bars: 500 µM (overall image), 100 µM (zoom) l, m Confocal microscopic image (l) of zebrafish vasculature of tg(fli1:EGFP) embryos at 72 h post-fertilization (hpf) injected without or with 1 µg µl−1 oxPAPC into yolk at 0.5 hpf. White arrows indicate hyperbranches and yellow arrows indicate partial normal intersegmental vessels. Quantitative morphological analysis (m) in control (n = 30) and oxPAPC (n = 31) group shows hyperbranches (Hyper), partial normal (P-ISV) and intact (I-ISV) intersegmental vessels per embryo. The experiment was performed two times. Scale bar: 100 µM. n qRT-PCR of zebrafish embryos in m normalized to elongation factor 1-alpha (elfa) (4–5 embryos pooled per sample) (n = 7). or Confocal microscopic image (o) and quantification (pr) of tg(fli1:EGFP) embryos at 72 hpf injected with control (n = 20) or mthfd2 morpholino (n = 20) at 0.5 hpf with (n = 19) and without 1 µg µl−1 oxPAPC (n = 20). Data are represented as mean ± SEM; c−i *p ≤ 0.05 (MTHFD2 vs Control siRNA), #p ≤ 0.05 (with vs without amino acid), $p ≤ 0.05 (VEGFA vs Ct) (ANOVA with Bonferroni post-hoc test); m−r *p ≤ 0.05 (oxP vs Ct), #p ≤ 0.05 (mthfd2 vs control morpholino) (ANOVA with Newman−Keuls post-hoc test). s Proposed model of findings
Fig. 7
Fig. 7
MTHFD2 is deregulated in cardiovascular disease. a Glycine to serine ratio in plasma of human subjects with no atherosclerotic plaque (NP) (n = 26), stable atherosclerotic plaque (SP) (n = 26), and unstable atherosclerotic plaque (UP) (n = 26) as assessed by mass spectrometry. b Scatter plots showing expression correlation in 126 human carotid plaque samples between MTHFD2 and genes of the MTHFD2 network (colored according to Fig. 3a) as well as Nrf2 (NFE2L2) and ATF4 as calculated by Pearson correlation. c, d Relative mRNA expression of MTHFD2 and SHMT2 in plaque material of human subjects with unstable atherosclerotic plaque (UP) (n = 20), stable atherosclerotic plaque (SP) (n = 20), or non-atherosclerotic artery (NP) (n = 8) (normalized to 18SrRNA) (n = 8). e, f Western blot analysis of MTHFD2 expression (e) and quantification (f) of plaque material from human subjects with unstable atherosclerotic plaque (SP) (n = 20), stable atherosclerotic plaque (SP) (n = 20), or non-atherosclerotic artery (NP) (n = 8). gj Relative mRNA expression of Mthfd2, Phgdh, Shmt2, and Slc3a2 in mouse thoracic aortic rings kept in organ culture and exposed to medium (1% FCS) with or without oxPAPC and rapamycin as indicated for 8 h (normalized to 18SrRNA) (n ≥ 4). k, l Relative mRNA expression of Mthfd2 and Shmt2 in the endothelium of partially ligated left carotid artery (LCA) compared to healthy right carotid artery (RCA) 48 h post ligation (normalized to 18S rRNA) (n = 3). (*p ≤ 0.05 Student’s t test). m Relative mRNA expression of Mthfd2 in the endothelium of the left carotid artery of ApoE−/− mice which were fed with high fat diet (HFD) for 0, 1, or 4 days (normalized to 18S rRNA) (n = 5). nq Relative mRNA expression of MTHFD2, PHGDH, CEBPB and PCK2 in HAEC exposed to HDL from healthy human subjects (n = 10) or human subjects with CAD (n = 10) for 4 h. (*p ≤ 0.05 Mann Whitney test). r, s Western blot analysis of MTHFD2 (r) and quantification (s) of HAEC treated as in f for 24 h (n = 10) (*p ≤ 0.05 Mann Whitney test). Data are represented as mean ± SEM, *p ≤ 0.05 (ANOVA with Newman−Keuls post-hoc test if not otherwise indicated)

References

    1. Gimbrone MA, García-Cardeña G. Endothelial cell dysfunction and the pathobiology of atherosclerosis. Circ. Res. 2016;118:620–636. doi: 10.1161/CIRCRESAHA.115.306301. - DOI - PMC - PubMed
    1. Nègre-Salvayre A, et al. Dual signaling evoked by oxidized LDLs in vascular cells. Free Radic. Biol. Med. 2017;106:118–133. doi: 10.1016/j.freeradbiomed.2017.02.006. - DOI - PubMed
    1. Miller YI, Shyy JYJ. Context-dependent role of oxidized lipids and lipoproteins in inflammation. Trends Endocrinol. Metab. 2017;28:143–152. doi: 10.1016/j.tem.2016.11.002. - DOI - PMC - PubMed
    1. Gargalovic PS, et al. Identification of inflammatory gene modules based on variations of human endothelial cell responses to oxidized lipids. Proc. Natl. Acad. Sci. USA. 2006;103:12741–12746. doi: 10.1073/pnas.0605457103. - DOI - PMC - PubMed
    1. Romanoski CE, et al. Network for activation of human endothelial cells by oxidized phospholipids: a critical role of heme oxygenase 1. Circ. Res. 2011;109:e27–e41. doi: 10.1161/CIRCRESAHA.111.241869. - DOI - PMC - PubMed

Publication types

MeSH terms