. 2019 Jan;21(1):114-123.
doi: 10.1038/s41436-018-0033-5. Epub 2018 Jun 12.

Prevalence and properties of intragenic copy-number variation in Mendelian disease genes

Affiliations

Prevalence and properties of intragenic copy-number variation in Mendelian disease genes

Rebecca Truty et al. Genet Med. 2019 Jan.

Abstract

Purpose: We investigated the frequencies and characteristics of intragenic copy-number variants (CNVs) in a deep sampling of disease genes associated with monogenic disorders.

Methods: Subsets of 1507 genes were tested using next-generation sequencing to simultaneously detect sequence variants and CNVs in >143,000 individuals referred for genetic testing. We analyzed CNVs in gene panels for hereditary cancer syndromes and cardiovascular, neurological, or pediatric disorders.

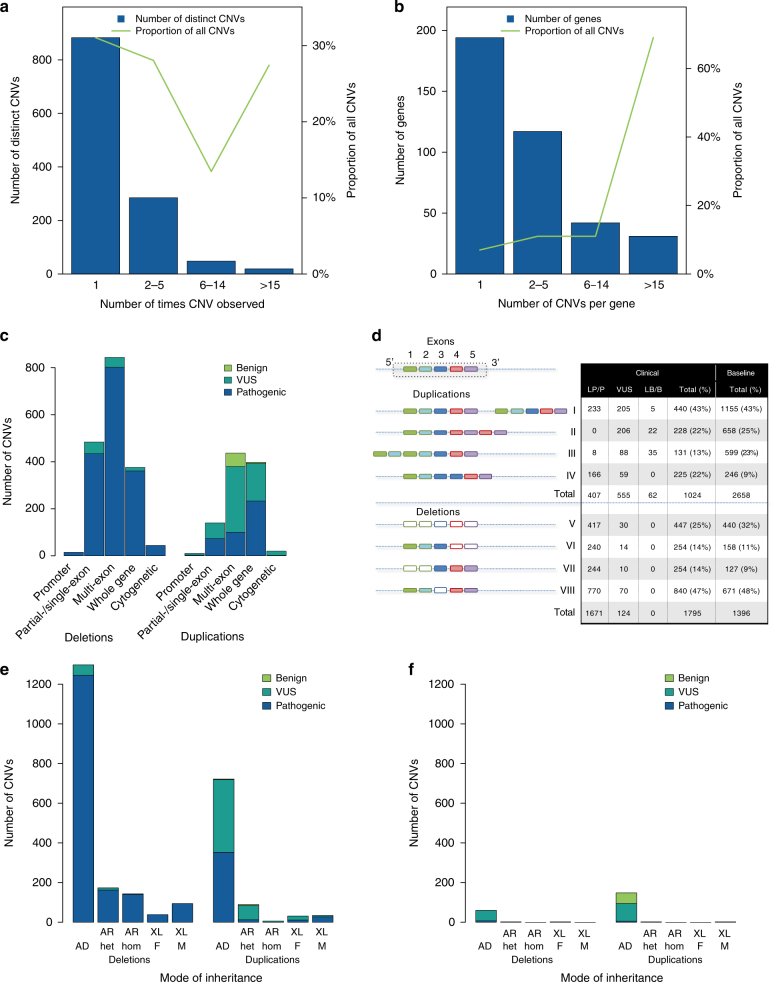
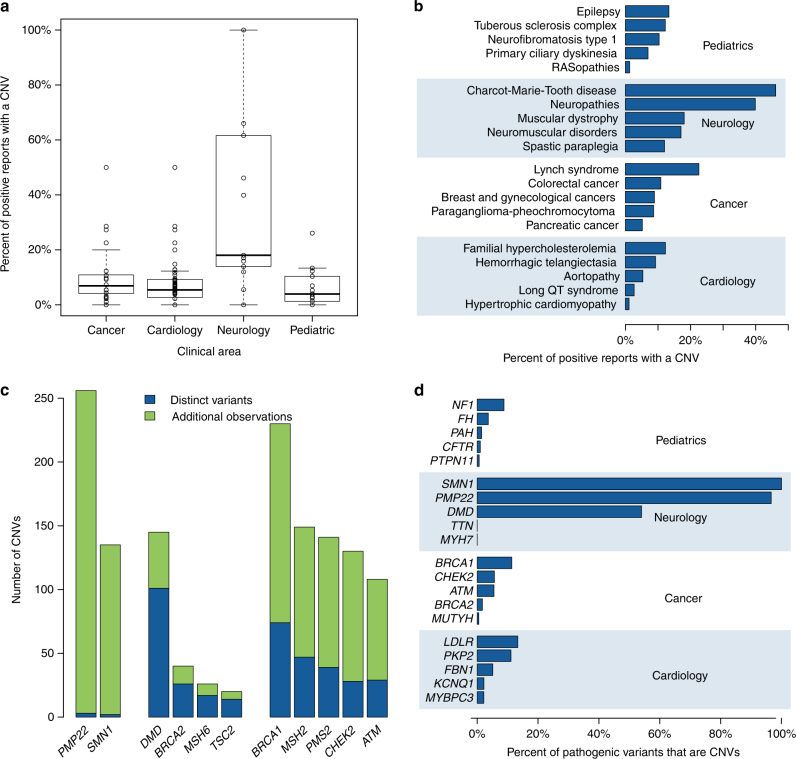
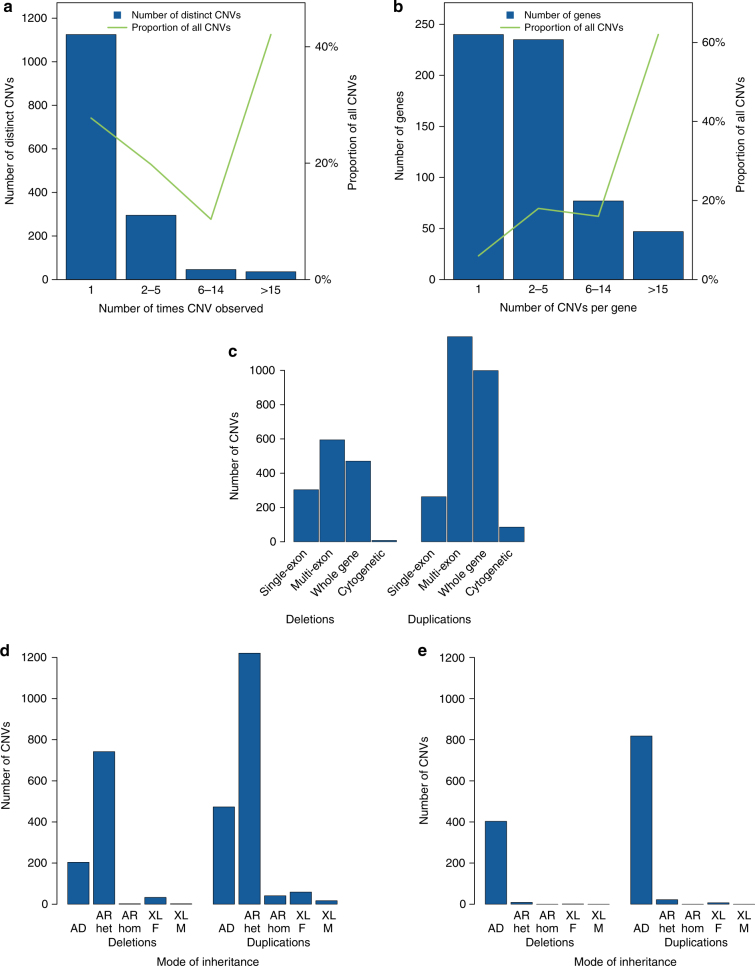
Results: Our analysis identified 2844 intragenic CNVs in 384 clinically tested genes. CNVs were observed in 1.9% of the entire cohort but in a disproportionately high fraction (9.8%) of individuals with a clinically significant result. CNVs accounted for 4.7-35% of pathogenic variants, depending on clinical specialty. Distinct patterns existed among CNVs in terms of copy number, location, exons affected, clinical classification, and genes affected. Separately, analysis of de-identified data for 599 genes unrelated to the clinical phenotype yielded 4054 CNVs. Most of these CNVs were novel rare events, present as duplications, and enriched in genes associated with recessive disorders or lacking loss-of-function mutational mechanisms.

Conclusion: Universal intragenic CNV analysis adds substantial clinical sensitivity to genetic testing. Clinically relevant CNVs have distinct properties that distinguish them from CNVs contributing to normal variation in human disease genes.

Keywords: Diagnostic genetic testing; Intragenic deletion/duplication copy-number variant; Next-generation sequencing panel; Pathogenic variation prevalence; Structural variant.


Figures

Fig. 1
Fig. 1. Frequency, size, interpretation, and distribution of copy-number variants (CNVs) observed in clinically tested genes.
a Histogram showing the number of distinct CNVs observed in the tested genes. The columns in the chart indicate the number of times the CNVs were observed. The line graph shows the proportion of total observed CNVs in each frequency bin. For example, the first column shows that nearly 900 CNVs occurred just once and, in aggregate, accounted for roughly 30% of all CNVs. b Histogram showing the number of genes that contained CNVs in our clinical cohort. The columns in the chart show incremental increases in the number of CNVs observed in a gene. The line graph shows the proportion of CNVs at arbitrary increments of CNV occurrence per gene. For example, nearly 200 genes had just 1 CNV, which together accounted for less than 10% of all events. By contrast, approximately 30 genes had more than 15 CNVs each, which represented nearly 70% of all CNVs. c Distribution of deletions and duplications by number of exons affected and by clinical interpretation. Cytogenetic events are defined as contiguous CNVs of the same zygosity affecting neighboring genes on a single chromosome. Some whole-gene events may in fact be part of larger cytogenetic events but are not listed as such because other genes within the predicted cytogenetic event were absent from our assay and therefore unavailable for analysis. d Count of CNV duplications and deletions detected in clinical and baseline CNV data. CNVs are split into those including a whole gene (classes I, V), at least the last exon (classes II, VI), at least the first exon (classes III, VII), or only an internal exon(s) (classes IV, VIII). A generic gene structure is shown at the top. Green and purple boxes denote “terminal exons” and all others are “internal exons,” as described in the text. Empty boxes indicate deleted exons. This figure assumes that intragenic duplications occur in tandem, which is often the case with such events. CNVs involving just promoter regions are not represented in this figure. A Pearson’s chi-squared contingency table gives a p value of p < 1×10⁻⁵ for duplications and p = 1.5×10⁻⁵ for deletions, indicating that the difference in the distribution of CNVs across the gene is not merely due to sampling differences between clinical and baseline CNVs. e and f Deletions and duplications in clinically tested genes and their interpretations. The chart in (e) shows genes with loss-of-function (LOF) mutational mechanisms, and that in (f) shows genes without loss-of-function (LOF) mechanisms. Most genes included in our panels were curated as having LOF mechanisms. The clinical classification of each CNV, inheritance pattern of the gene with the CNV, and zygosity of the variants are compared. For X-linked (XL) genes, heterozygous CNVs in females are shown separately from CNVs in males. AD autosomal dominant, AR autosomal recessive, F female, het heterozygous, hom homozygous, M male, LP likely pathogenic variant, P pathogenic variant, VUS variants of uncertain significance. The “Pathogenic” label in c, e, and f includes CNVs classified as pathogenic and likely pathogenic
Fig. 2
Fig. 2. Pathogenic copy-number variants (CNVs) by gene and panel.
a Panels in each clinical specialty are shown with the percentage of positive reports that included one or more pathogenic CNVs. Only panels that were clinically tested at least 100 times and had at least 10 pathogenic variants of any type are included. Each panel is represented by a circle. b Proportion of positive reports that included pathogenic CNVs in various panels. These panels were the top five with the most pathogenic variants in each clinical specialty. c Three patterns of CNV occurrence were discernible: recurrent events (e.g., in PMP22 and SMN1), predominantly rare unique events (e.g., in DMD and BRCA2), and a mix of both (e.g., in BRCA1 and MSH2). The number of distinct variants is shown in blue, and additional/recurrent observations of these variants are shown in green. d Fraction of pathogenic variants that were CNVs in various genes. The top five genes with the most pathogenic variants of any type are shown in each clinical specialty
Fig. 3
Fig. 3. Baseline copy-number variants (CNVs) unrelated to clinical phenotype in a large cohort.
The clinical significance of these CNVs was not evaluated beyond their being deletions in American College of Medical Genetics and Genomics–listed genes with known loss-of-function (LOF) mutational mechanisms. CNVs in genes that belonged to the same clinical specialty as those ordered for clinical testing were removed from the analysis. Single-exon low-quality calls were removed to reduce potential false-positive calls. a Histogram showing the number of distinct CNVs observed in genes analyzed for baseline CNVs. The columns in the chart show the number of times the CNVs were observed. The line graph shows the proportion of total observed CNVs in each frequency bin. For example, the first column shows that more than 1100 CNVs occurred just once and, in aggregate, accounted for roughly 25% of all CNVs. By contrast, the last column indicates that 36 CNVs were found more than 15 times and represented more than 40% of all baseline CNVs. b Histogram showing the number of genes that contained baseline CNVs. The columns in the chart show incremental increases in the number of CNVs observed in a gene. The line graph shows the proportion of CNVs at arbitrary increments of CNV occurrence per gene. For example, nearly 240 genes had just one CNV, and together these CNVs accounted for roughly 6% of all events. By contrast, approximately 45 genes had more than 15 CNVs each, which represented slightly more than 60% of all CNVs. c Distribution of baseline CNVs is shown according to the number of exons affected. Multiexon CNVs include three classes of 5′ terminal exons, internal exons, and 3′ terminal exons. (D and E) Burden of baseline CNVs in genes according to mode of inheritance and zygosity. CNVs in genes with LOF mutational mechanisms are shown in part (d) and those in genes without LOF mechanisms are shown in part (e). CNVs in X-linked (XL) genes were categorized as those observed as heterozygous events in females and hemizygous events in males. AD autosomal dominant, AR autosomal recessive, F female, M male, het heterozygous, hom homozygous

References

    1. Pfundt R, Del Rosario M, Vissers L, et al. Detection of clinically relevant copy-number variants by exome sequencing in a large cohort of genetic disorders. Genet Med. 2017;19:667–75. doi: 10.1038/gim.2016.163. - DOI - PMC - PubMed
    1. Retterer K, Scuffins J, Schmidt D, et al. Assessing copy number from exome sequencing and exome array CGH based on CNV spectrum in a large clinical cohort. Genet Med. 2015;17:623–9. doi: 10.1038/gim.2014.160. - DOI - PubMed
    1. Aradhya S, Lewis R, Bonaga T, et al. Exon-level array CGH in a large clinical cohort demonstrates increased sensitivity of diagnostic testing for Mendelian disorders. Genet Med. 2012;14:594–603. doi: 10.1038/gim.2011.65. - DOI - PubMed
    1. Gambin T, Yuan B, Bi W, et al. Identification of novel candidate disease genes from de novo exonic copy number variants. Genome Med. 2017;9:83. doi: 10.1186/s13073-017-0472-7. - DOI - PMC - PubMed
    1. Dhami P, Coffey AJ, Abbs S, et al. Exon array CGH: detection of copy-number changes at the resolution of individual exons in the human genome. Am J Hum Genet. 2005;76:750–62. doi: 10.1086/429588. - DOI - PMC - PubMed

MeSH terms