

Analysis of the Co-existence of Long-range Transport Biomass Burning and Dust in the Subtropical West Pacific Region
- PMID: 29895886
- PMCID: PMC5997683
- DOI: 10.1038/s41598-018-27129-2
Analysis of the Co-existence of Long-range Transport Biomass Burning and Dust in the Subtropical West Pacific Region
Abstract
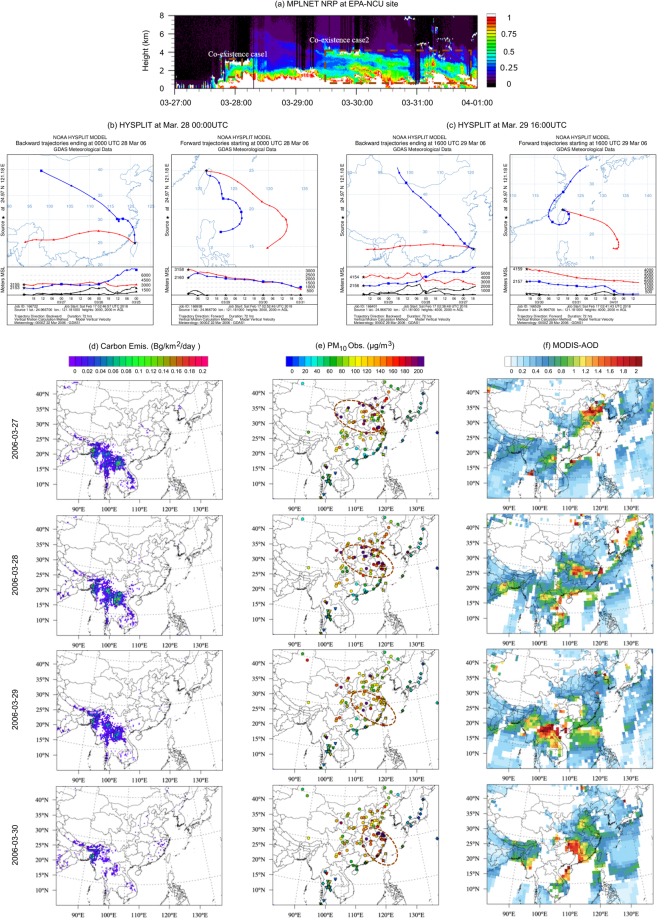
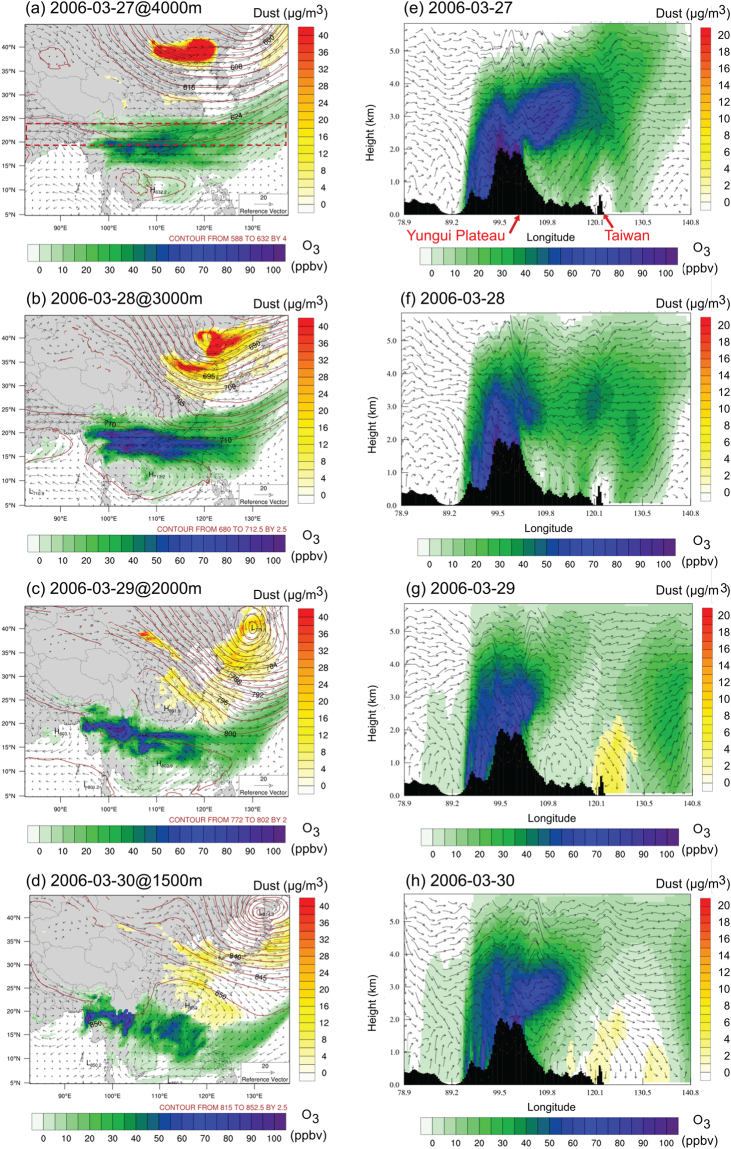
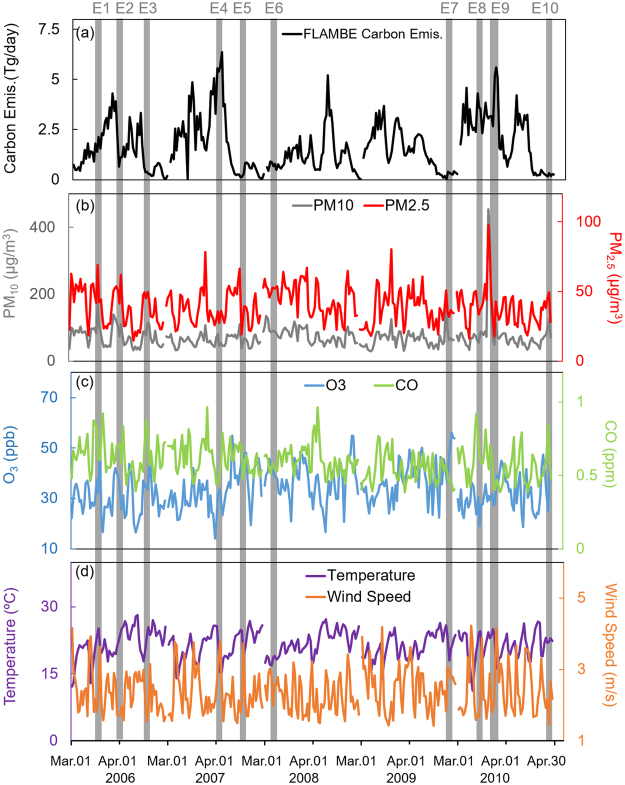
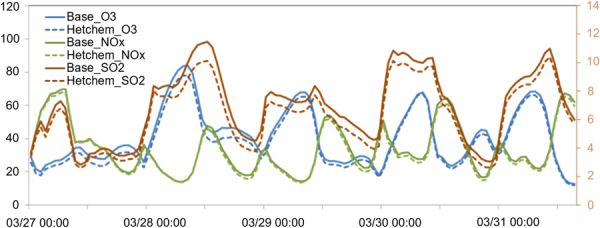
Biomass burning and wind-blown dust has been well investigated during the past decade regarding their impacts on environment, but their co-existence hasn't been recognized because they usually occur in different locations and episodes. In this study we reveal the unique co-existence condition that dust from the Taklamakan and Gobi Desert (TGD) and biomass burning from Peninsular Southeast Asia (PSEA) can reach to the west Pacific region simultaneously in boreal spring (March and April). The upper level trough at 700hPa along east coast of China favors the large scale subsidence of TGD dust while it travels southeastwards, and drives the PSEA biomass burning plume carried by the westerlies at 3-5 km to descend rapidly to around 1.5 km and mix with dust around southeast China and Taiwan. As compared to the monthly averages in March and April, surface observations suggested that concentrations of PM10, PM2.5, O3, and CO were 69%, 37%, 20%, and 18% higher respectively during the 10 identified co-existence events which usually lasted for 2-3 days. Co-existence also lowers the surface O3, NOx, and SO2 by 4-5% due to the heterogeneous chemistry between biomass burning and mineral dust as indicated by model simulations.
Conflict of interest statement
The authors declare no competing interests.
Figures

References
-
- van der Werf GR, et al. Global fire emissions and the contribution of deforestation, savanna, forest, agricultural, and peat fires (1997-2009) Atmospheric Chemistry and Physics. 2010;10:11707–11735. doi: 10.5194/acp-10-11707-2010. - DOI
-
- Shao Y, Dong CH. A review on East Asian dust storm climate, modelling and monitoring. Global and Planetary Change. 2006;52:1–22. doi: 10.1016/j.gloplacha.2006.02.011. - DOI
-
- Yen MC, et al. Climate and weather characteristics in association with the active fires in northern Southeast Asia and spring air pollution in Taiwan during 2010 7-SEAS/Dongsha Experiment. Atmospheric Environment. 2013;78:35–50. doi: 10.1016/j.atmosenv.2012.11.015. - DOI
-
- Reid JS, et al. Global Monitoring and Forecasting of Biomass-Burning Smoke: Description of and Lessons From the Fire Locating and Modeling of Burning Emissions (FLAMBE) Program. Ieee Journal of Selected Topics in Applied Earth Observations and Remote Sensing. 2009;2:144–162. doi: 10.1109/JSTARS.2009.2027443. - DOI
-
- Dong XY, Fu JS. Understanding interannual variations of biomass burning from Peninsular Southeast Asia, part II: Variability and different influences in lower and higher atmosphere levels. Atmospheric Environment. 2015;115:9–18. doi: 10.1016/j.atmosenv.2015.05.052. - DOI
Publication types
LinkOut - more resources
Full Text Sources
Other Literature Sources
Research Materials
Miscellaneous
