

Role of recombination and faithfulness to partner in sex chromosome degeneration
- PMID: 29895905
- PMCID: PMC5997740
- DOI: 10.1038/s41598-018-27219-1
Role of recombination and faithfulness to partner in sex chromosome degeneration
Abstract
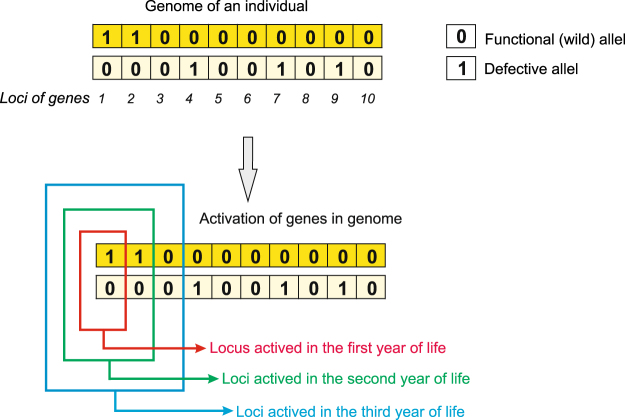
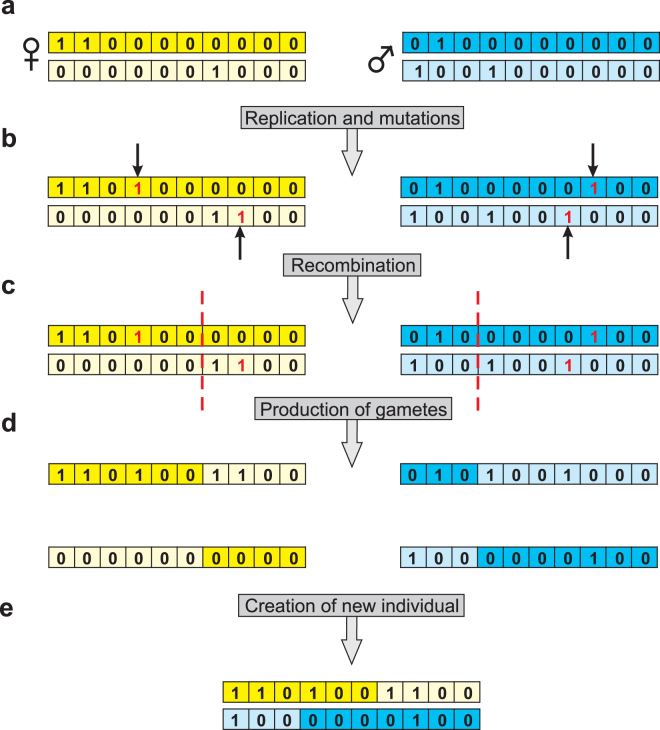
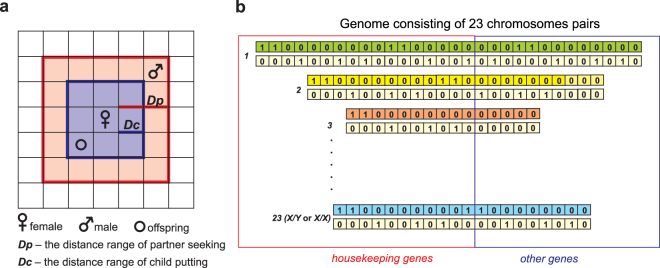
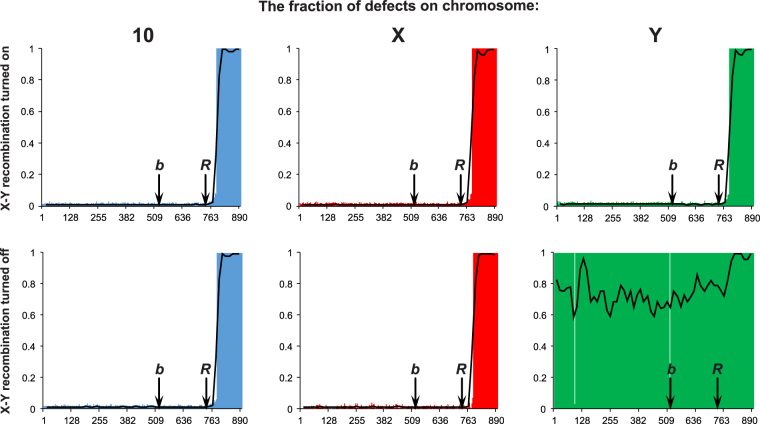
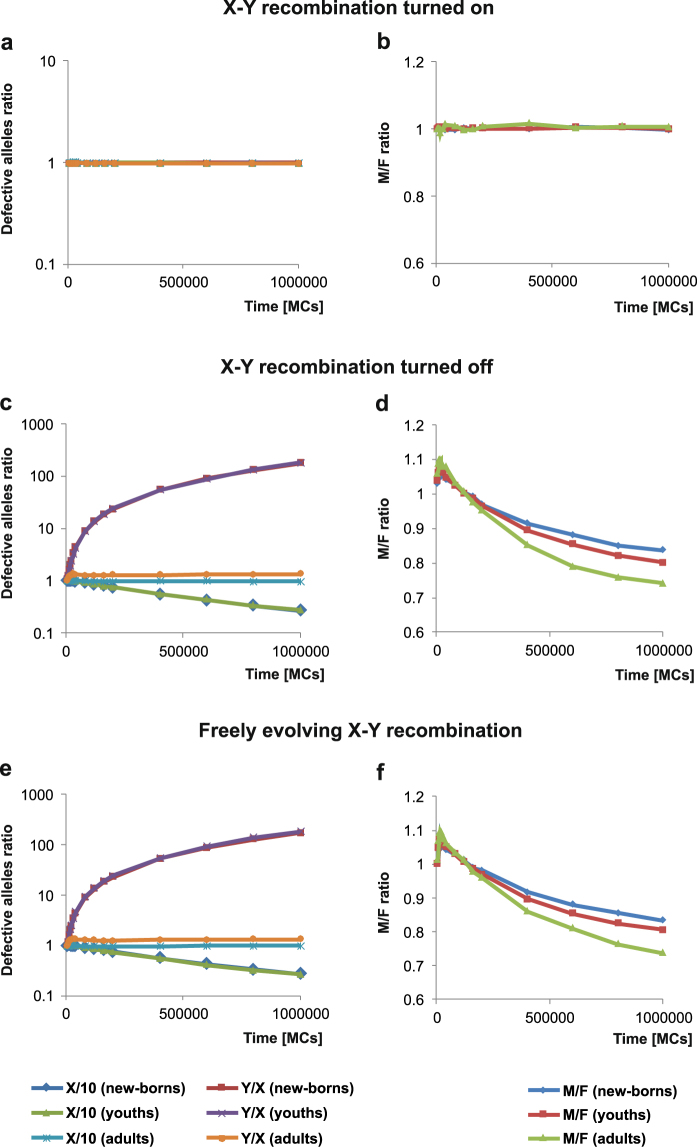
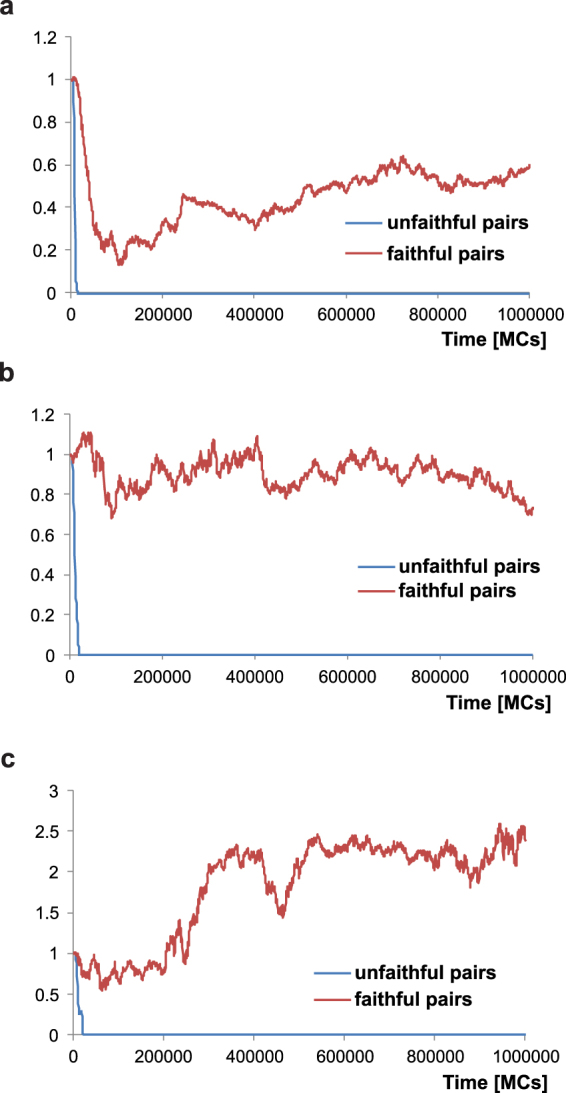
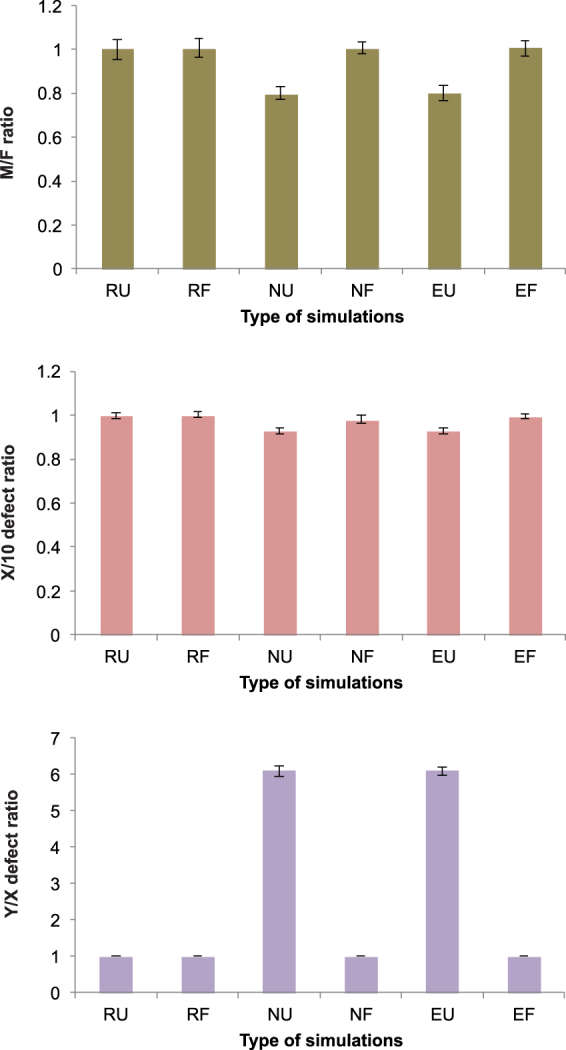
Sex determination in mammals is strongly linked to sex chromosomes. In most cases, females possess two copies of X chromosome while males have one X and one Y chromosome. It is assumed that these chromosomes originated from a pair of homologous autosomes, which diverged when recombination between them was suppressed. However, it is still debated why the sex chromosomes stopped recombining and how this process spread out over most part of the chromosomes. To study this problem, we developed a simulation model, in which the recombination rate between the sex chromosomes can freely evolve. We found that the suppression of recombination between the X and Y is spontaneous and proceeds very quickly during the evolution of population, which leads to the degeneration of the Y in males. Interestingly, the degeneration happens only when mating pairs are unfaithful. This evolutionary strategy purifies the X chromosome from defective alleles and leads to the larger number of females than males in the population. In consequence, the reproductive potential of the whole population increases. Our results imply that both the suppression of recombination and the degeneration of Y chromosome may be associated with reproductive strategy and favoured in polygamous populations with faithless mating partners.
Conflict of interest statement
The authors declare no competing interests.
Figures
Similar articles
-
Reconstructing the evolution of vertebrate sex chromosomes.Cold Spring Harb Symp Quant Biol. 2009;74:345-53. doi: 10.1101/sqb.2009.74.048. Epub 2010 May 27. Cold Spring Harb Symp Quant Biol. 2009. PMID: 20508063 Review.
-
Long-Term Fragility of Y Chromosomes Is Dominated by Short-Term Resolution of Sexual Antagonism.Genetics. 2017 Dec;207(4):1621-1629. doi: 10.1534/genetics.117.300382. Epub 2017 Oct 11. Genetics. 2017. PMID: 29021279 Free PMC article.
-
Tales of the Y chromosome.Nature. 2003 Jun 19;423(6942):810-1, 813. doi: 10.1038/423810a. Nature. 2003. PMID: 12815408 No abstract available.
-
Detecting evolutionary strata on the human x chromosome in the absence of gametologous y-linked sequences.Genome Biol Evol. 2013;5(10):1863-71. doi: 10.1093/gbe/evt139. Genome Biol Evol. 2013. PMID: 24036954 Free PMC article.
-
The evolution of restricted recombination in sex chromosomes.Trends Ecol Evol. 2009 Feb;24(2):94-102. doi: 10.1016/j.tree.2008.09.010. Epub 2008 Dec 25. Trends Ecol Evol. 2009. PMID: 19100654 Review.
Cited by
-
Fragile, unfaithful and persistent Ys-on how meiosis can shape sex chromosome evolution.Heredity (Edinb). 2022 Jul;129(1):22-30. doi: 10.1038/s41437-022-00532-2. Epub 2022 Apr 22. Heredity (Edinb). 2022. PMID: 35459933 Free PMC article.
-
Identification of genomic regions regulating sex determination in Atlantic salmon using high density SNP data.BMC Genomics. 2019 Oct 22;20(1):764. doi: 10.1186/s12864-019-6104-4. BMC Genomics. 2019. PMID: 31640542 Free PMC article.
-
Genomic analyses provide insights into sex differentiation of tetraploid strawberry (Fragaria moupinensis).Plant Biotechnol J. 2024 Jun;22(6):1552-1565. doi: 10.1111/pbi.14286. Epub 2024 Jan 6. Plant Biotechnol J. 2024. PMID: 38184782 Free PMC article.
References
-
- Honda T, Itoh M. An unusual sex chromosome constitution found in the Amami spinous country-rat. Tokudaia osimensis osimensis. Jpn J. Genet. 1977;52:247–249. doi: 10.1266/jjg.52.247. - DOI
-
- Ohno, S. Sex chromosomes and sex-linked genes. (Springer-Verlag, 1967).
-
- Rice, W. R. Sex chromosomes and the evolution of sexual dimorphism. Evolution 38, (1984). - PubMed
Publication types
MeSH terms
LinkOut - more resources
Full Text Sources
Other Literature Sources
