

Phenotypic Switching Can Speed up Microbial Evolution
- PMID: 29895935
- PMCID: PMC5997679
- DOI: 10.1038/s41598-018-27095-9
Phenotypic Switching Can Speed up Microbial Evolution
Abstract
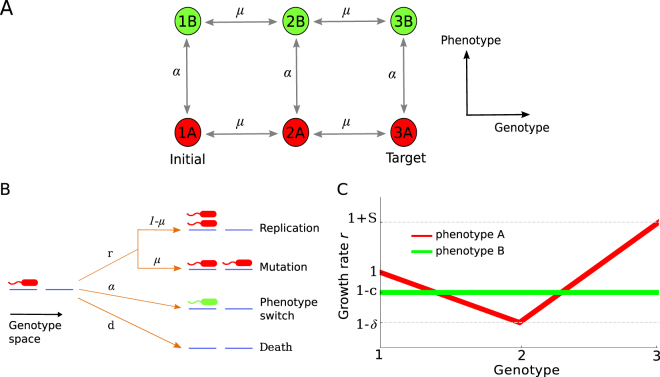
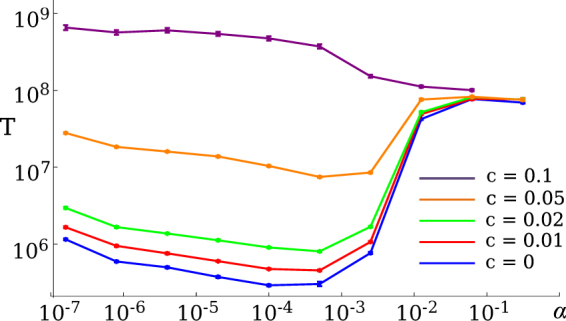
Stochastic phenotype switching has been suggested to play a beneficial role in microbial populations by leading to the division of labour among cells, or ensuring that at least some of the population survives an unexpected change in environmental conditions. Here we use a computational model to investigate an alternative possible function of stochastic phenotype switching: as a way to adapt more quickly even in a static environment. We show that when a genetic mutation causes a population to become less fit, switching to an alternative phenotype with higher fitness (growth rate) may give the population enough time to develop compensatory mutations that increase the fitness again. The possibility of switching phenotypes can reduce the time to adaptation by orders of magnitude if the "fitness valley" caused by the deleterious mutation is deep enough. Our work has important implications for the emergence of antibiotic-resistant bacteria. In line with recent experimental findings, we hypothesise that switching to a slower growing - but less sensitive - phenotype helps bacteria to develop resistance by providing alternative, faster evolutionary routes to resistance.
Conflict of interest statement
The authors declare no competing interests.
Figures


Similar articles
-
The evolution of phenotypic switching in subdivided populations.Genetics. 2014 Apr;196(4):1185-97. doi: 10.1534/genetics.114.161364. Epub 2014 Feb 4. Genetics. 2014. PMID: 24496012 Free PMC article.
-
Evolution of stochastic switching rates in asymmetric fitness landscapes.Genetics. 2009 Aug;182(4):1159-64. doi: 10.1534/genetics.109.103333. Epub 2009 May 27. Genetics. 2009. PMID: 19474199 Free PMC article.
-
Escaping an evolutionary lobster trap: drug resistance and compensatory mutation in a fluctuating environment.Evolution. 2011 May;65(5):1376-87. doi: 10.1111/j.1558-5646.2011.01223.x. Epub 2011 Feb 1. Evolution. 2011. PMID: 21521192
-
Dynamics of bacterial adaptation.Biochem Soc Trans. 2021 Apr 30;49(2):945-951. doi: 10.1042/BST20200885. Biochem Soc Trans. 2021. PMID: 33843990 Free PMC article. Review.
-
Links between evolutionary processes and phenotypic robustness in microbes.Semin Cell Dev Biol. 2019 Apr;88:46-53. doi: 10.1016/j.semcdb.2018.05.017. Epub 2018 Jun 19. Semin Cell Dev Biol. 2019. PMID: 29803630 Review.
Cited by
-
Competing evolutionary paths in growing populations with applications to multidrug resistance.PLoS Comput Biol. 2019 Apr 15;15(4):e1006866. doi: 10.1371/journal.pcbi.1006866. eCollection 2019 Apr. PLoS Comput Biol. 2019. PMID: 30986219 Free PMC article.
-
Phenotypic Plasticity, Non-genetic Mechanisms, and Immune Drug Resistance in Cancer.Cancer Treat Res. 2025;129:309-324. doi: 10.1007/978-3-031-97242-3_14. Cancer Treat Res. 2025. PMID: 40847239 Review.
-
The energy-spectrum of bicompatible sequences.Algorithms Mol Biol. 2021 Jun 1;16(1):7. doi: 10.1186/s13015-021-00187-4. Algorithms Mol Biol. 2021. PMID: 34074304 Free PMC article.
-
A quantitative characterization of the heterogeneous response of glioblastoma U-87 MG cell line to temozolomide.Sci Rep. 2025 May 8;15(1):16017. doi: 10.1038/s41598-025-99426-6. Sci Rep. 2025. PMID: 40341226 Free PMC article.
-
Metabolomic profiling of VOC-driven interactions between Priestia megaterium and Bacillus licheniformis in a simulated rhizosphere using split petri dishes.Arch Microbiol. 2025 Aug 12;207(9):224. doi: 10.1007/s00203-025-04426-9. Arch Microbiol. 2025. PMID: 40794197 Free PMC article.
References
Publication types
MeSH terms
LinkOut - more resources
Full Text Sources
Other Literature Sources
