. 2018 Jun 12;8(1):8992.
doi: 10.1038/s41598-018-26696-8.

A Dual-Modality Hybrid Imaging System Harnesses Radioluminescence and Sound to Reveal Molecular Pathology of Atherosclerotic Plaques

Affiliations

A Dual-Modality Hybrid Imaging System Harnesses Radioluminescence and Sound to Reveal Molecular Pathology of Atherosclerotic Plaques

Raiyan T Zaman et al. Sci Rep. .

Abstract

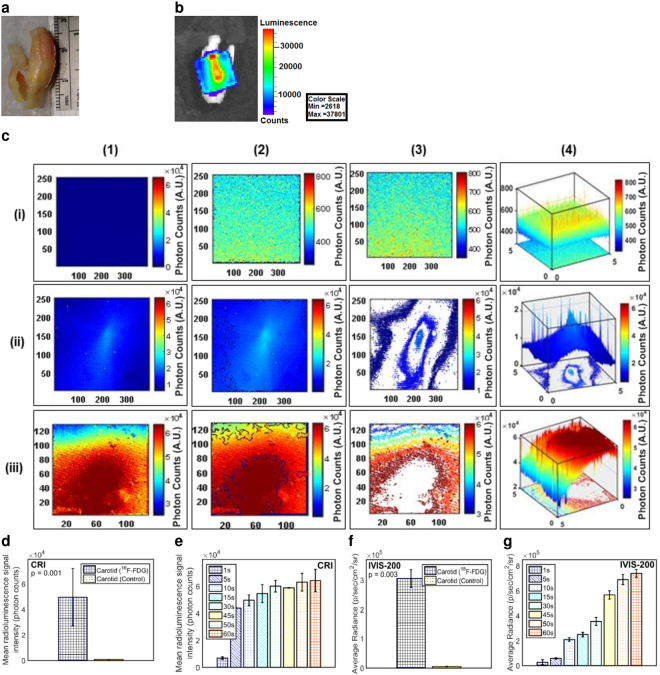
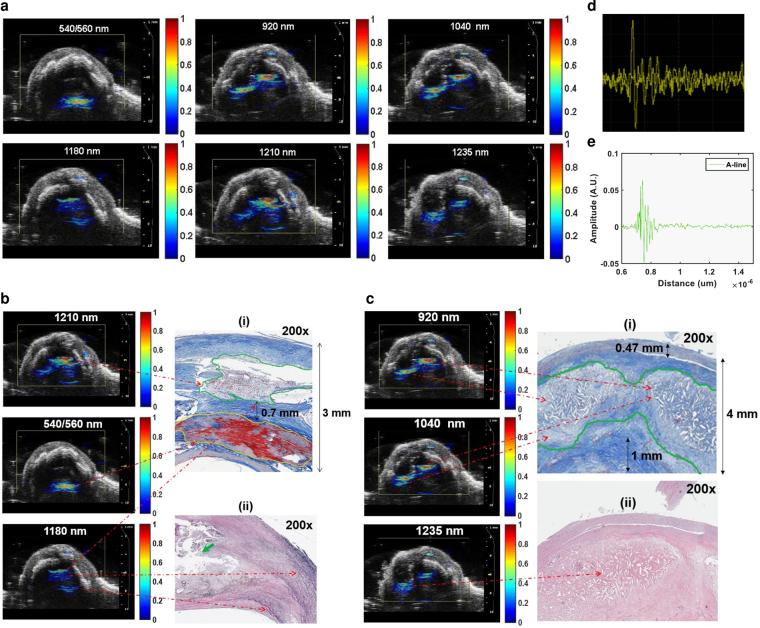
Atherosclerosis is a progressive inflammatory condition caused by an unstable lesion, called thin-cap fibro atheromata (TCFA) that underlies coronary artery disease (CAD)-one of the leading causes of death worldwide. Therefore, early clinical diagnosis and effective risk stratification is important for CAD management as well as preventing progression to catastrophic events. However, early detection could be difficult due to their small size, motion, obscuring 18F-FDG uptake by adjacent myocardium, and complex morphological/biological features. To overcome these limitations, we developed a catheter-based Circumferential-Intravascular-Radioluminescence-Photoacoustic-Imaging (CIRPI) system that can detect vulnerable plaques in coronary arteries and characterizes them with respect to pathology and biology. Our CIRPI system combined two imaging modalities: Circumferential Radioluminescence Imaging (CRI) and PhotoAcoustic Tomography (PAT) within a novel optical probe. The probe's CaF2:Eu based scintillating imaging window provides a 360° view of human (n = 7) and murine carotid (n = 10) arterial plaques by converting β-particles into visible photons during 18F-FDG decay. A 60× and 63× higher radioluminescent signals were detected from the human and murine plaque inflammations, respectively, compared to the control. The system's photoacoustic imaging provided a comprehensive analysis of the plaque compositions and its morphologic information. These results were further verified with IVIS-200, immunohistochemical analysis, and autoradiography.


Conflict of interest statement

Michael V. McConnell is currently a Clinical Professor at the Stanford University School of Medicine and an employee of Verily Life Sciences; however, this does not alter our adherence to the Scientific Reports policies on sharing data and materials.

Figures

Figure 1
Figure 1
Schematic diagram of (a) the dual-modality CIRPI system for detection and characterization of atherosclerotic plaque. The CIRPI system has three main components (1) CRI, detects and outlines the location of vulnerable plaque by identifying macrophage accumulations, (2) PAT, characterize the plaque by disease tissue compositions, and (3) optical probe that collects radioluminescent and PA signals. CRI peripheral system consists of (1) a 10× magnification infinity-corrected microscope objective (2) an infinity-corrected tube lens for plan fluoride objective in between the objective (F2 = 102 mm) and the ProEM charge-coupled device (CCD) camera (F3 = 200 mm). PAT system consists of (1) tunable laser, (2) pulse signal generator (3) 4-channell delay generator (4) pulser-receiver (5) oscilloscope (6) laptop with EasyScopeX software. (b) Photograph of the novel probe with scintillating imaging window made from CaF2:Eu phosphor (scale bar: 1 mm), CaF2:Eu converts beta particles to visible photons (c) tunable laser light is delivered through water coupled scintillating window at 540 nm (Visible, green), 560 nm (Visible, green), and 1040 nm wavelength (NIR, Near InfraRed) (d) at 1180, 1210, and 1235 nm wavelength (IR, InfraRed); at 920 nm wavelength (NIR, not shown). (e) Schematic diagram of the novel probe design shows the main components (1) CaF2:Eu scintillating imaging window, (2) OF-1: 0.2 mm core multimode light guiding optical fiber, (3) OF-2: 18 K pixels imaging fiber, (4) UST: single element unfocused ultrasonic transducer, (5) digital actuator, and (6) 45° degree flat rotating mirror (f) enlarged image of the imaging window illustrates the orientation of OF-1, OF-2, and UST. Figure 1 is already published in the SNMMI Annual Conference Abstract.
Figure 2
Figure 2
Murine carotid artery images reveal pathognomonic features of plaques. (a) CRi Maestro images of ex vivo murine carotid arteries are taken one hour after 200 µCi of 18F-FDG IV injection, (i-1) non-ligated RCA (negative control, arrow points to the location where the edge detection software is implemented) and (ii-1) ligated LCA (arrow points to the ligation location, enlarged bulb shaped area, due to macrophage accumulation; long white area below the arrow is an artifact due to reflected light from CRi Maestro imaging system), and (iii-1) a 10× magnification of the full length histologic image of the LCA. After a 200× magnification, the dilated area of LCA near the ligation shows macrophage accumulation nearly filling the lumen of the vessel (yellow arrow) that is extend to 1 mm from the ligation location. The CRI images of (i-2) RCA shows only 700 photon counts, a trace amount of radioluminescent signal, where (ii-2) LCA shows almost 8 × 103 photons at the ligation and its surrounding area representing the presence of larger number of macrophages within the atherosclerotic plaque (1 × 1 binning). (iii-3) However, when the binning is increased to 4 × 4, the signal intensity rises to 60 × 103 photon counts and the radioluminescent signal extends to 1 mm from the ligation. (i-3) A custom written edge detection software is unable to show any edges in RCA, a clear indication of absence of macrophages (ii-3, iii-3) LCA highlights the area of macrophages with prominent edges. X and Y axes in these images (i-2, ii-2, iii-3, i-3, ii-3, iii-3) represent the effective active imaging resolutions in pixels. (i-4) The contour plot of RCA highlights a flat radioluminescent signal distribution and (ii-4, iii-4) a sharp peak is observed at the LCA plaque area. Confirmatory imaging with (b) IVIS-200 system (after a LSO scintillating screen is placed on the top of each sample) and (c) autoradiography show similar results as the CIRPI system. Statistical plots show that (d) the CIRPI images of LCAs are 63-fold brighter compared to RCAs (45 second exposure time) where (e) the IVIS-200 images of the same LCAs are 65-fold brighter than the RCAs (45 second exposure time), (f) the CIRPI images of all murine LCAs show a linear relationship between the radioluminescent signal intensity vs. exposure time. Radioluminescence is produced within the scintillating imaging window following the emission of a beta particle from a radiotracer (18F-FDG) within a macrophage. The optical photons were captured by a high-numerical-aperture 10× microscope objective coupled to a deep-cooled ProEM CCD camera. Radioluminescence signal was measured as photon counts in arbitrary units (A.U.). All results statistically significant (P < 0.05). Figure 2 is already published in the SNMMI Annual Conference Abstract.
Figure 3
Figure 3
CIRPI images correlate with conventional ultrasound and histological images. (a) Reconstructed PAT images at multiple wavelengths are superimposed on a Vevo 2100 collected ultrasound image of the same murine LCA shown in Fig. 2. The PAT images show a precise alignment with the ultrasound images. For this specific murine model, there is no other plaque compositions identified using the CIRPI system except for elastin and collagen at 1180 nm wavelength representing an area of 7.5 mm in length. (b) A single PA signal (A-line) is captured with an oscilloscope; (c) an A-line is captured when the CIRPI probe is placed in close proximity of 0.8 µm and laser is excited at 1180 nm wavelength using a 7 ns tunable pulsed laser at 20 Hz repetition rate with 100% energy efficiency. Histochemical analysis at (d-i)10× magnification of this 7.5 mm long (without the bulb or ligation location) LCA sample (EVG stain) is further magnified to (d-ii) 40× to highlight the suture material at the ligation end (orange arrow) and the adjacent dilated 1 mm long vessel lumen (green oval), containing macrophage accumulation, thrombus and small amounts of collagen deposition. (d-iii) 200× magnification of the dilation area near the ligated end of the LCA shows thrombus (green arrow), black staining elastic fiber (red arrow), muscle fiber (yellow arrow), 0.5 mm thick muscle wall (black double arrow) and 1 mm long area of macrophage accumulation (orange highlight) located at 6.5 mm away from the non-ligated end of the LCA. (d-iv) Trichrome stain of dilatation area near the ligated end of LCA shows small strands of collagen highlighted in blue (purple arrow) with visible macrophage presence. According to the histochemical analyses, although there were extensive inflammation cells at the suture site as well as the perivascular area, these inflammatory cells provided no background signal for the PAT image of the murine LCA. All PA signals that were detected with our CIRPI system at 1180 nm was generated from the optical absorbers elastic fiber and collagen due to their thermo elastic expansion causing an acoustic pressure wave. Both EVG and trichrome stained sample illustrate one-to-one correlation to the highlighted area of the PAT image at 1180 nm wavelength associated with the CIRPI system (R2 = 0.97, p < 10−5). Figure 3 is already published in the SNMMI Annual Conference Abstract.
Figure 4
Figure 4
Human carotid endarterectomy sample images reveal pathognomonic features of plaques (a) photograph is taken with a smart phone, (b) a confirmatory IVIS-200 image yields high radioluminescent signal at the 18F-FDG injection site during the sample is placed under a scintillating LSO crystal screen (45 second exposure time at 8 × 8 binning). The sample is rotated to highlight the location of the 18F-FDG accumulation. (c) CRI image of (i-1) control sample (pre-injection) shows no radioluminescent signal with medium 4 × 4 binning; however, (ii-1) post-injection of 50 µCi 18F-FDG shows an immediate increase of radioluminescent signal with 2 × 104 photons at small 1 × 1 binning, (iii-1) 6 × 104 photons at medium 4 × 4 binning. A custom written edge detection software outlines the area with this high radioluminescent signal. (i-2) No edges are detected in the control, representing the absence of 18F-FDG. (ii-2, iii-2) Post-injection image shows a distinctive edge at the deposition of 18F-FDG. A custom written software highlights the contour of the 18F-FDG signal distribution. (i-3) No contour is detected in the control sample where (ii-3, iii-3) post-injection area of the atherosclerotic plaque showed well defined contour pattern. X and Y axes in these images (i-1, ii-1, iii-1, i-2, ii-2, iii-2, i-3, ii-3, iii-3) represent the effective active imaging resolutions in pixels. 3D plot of the radioluminescent signal intensity shows (i-4) a flat distribution of signal in the control, and (ii-4, iii-4) a sharp peak of radioluminescent signal at the post-injection area. Statistically based on CRI images of (d) all human carotid endarterectomy samples show a 60-fold higher radioluminescent signal at the atherosclerotic plaque area compared to the control (45 second exposure time with binning of 4 × 4); (e) a linear relationship is identified between radioluminescent signal intensity vs. exposure time. Similarly the confirmatory IVIS-200 images (f) yield a 62-fold brighter radioluminescent signal compared to the control (45 second exposure with binning of 4 × 4); (g) a linear relationship is established between radioluminescent signal intensity vs. exposure time. All results statistically significant (P < 0.05). Figure 4 is already published in the SNMMI Annual Conference Abstract.
Figure 5
Figure 5
CIRPI images correlate with conventional ultrasound and histological images. Reconstructed PAT images at multiple wavelengths are superimposed on a Vevo 2100 collected ultrasound image of the same human carotid endarterectomy sample shown in Fig. 4. A precise alignment is observed between the conventional ultrasound and the PAT images. (a) Human atherosclerotic plaques show complex structure when laser is tuned at various wavelengths (540/560 nm, 920 nm, 1040 nm, 1180 nm, 1210 nm, and 1235 nm) to identify different plaque compositions. PAT images for 540/560, 1180, and 1210 nm wavelength belong to specimen 1; 920, 1040, and 1235 nm belong to specimen 2. (b) In specimen 1 PA signals are identified at (i) 540/560 nm, 1210 nm, and 1180 nm representing the presence of calcification (1 mm long), cholesterol (1 mm long), collagen/elastin (0. 7 mm thick), respectively. However, for specimen 2 PA signals are detected at (ii) 920 nm, 1040 nm, and 1235 nm yield the presence of cholesterol ester, phospholipid, and triglyceride in 2 mm area, respectively. (b-i) Histochemical analysis of transverse or axial plane of the specimen 1 (200×) with Trichrome stain highlights various compositions of the plaque that covers over 90% of the 3 mm thick vessel. The compositions of the plaque include 1.0 mm area of lipid and cholesterol (green outline) that matches with the corresponding PAT image for 1210 nm wavelength. Orange outline highlights a 1.0 mm mineralized calcium material correspond to zones of calcification in the PAT image for 540/560 nm wavelength. Blue stain highlights 0.7 mm collagen deposition that matches with the PAT image for 1180 nm wavelength. (b-ii) Histochemical analysis of specimen 1 (200×) with EVG stain highlights elastic fibers (black stain pointed with green arrow adjacent to the plaque lipid/cholesterol) that matches with the corresponding PAT image for 1180 nm wavelength. (c-i) Histochemical analysis of specimen 2 (200×) Trichrome stain outlines two prominent lobes of cholesterol and lipid deposition (green outline) measuring 2.5 mm in thickness corresponds to the PAT images at 920 nm (cholesterol ester) and 1040 nm (phospholipids) wavelengths. The normal luminal wall thickness is less than 0.5 mm thick with normal vessel wall material (double black arrow). Collagen deposition (dark blue staining material, double black arrow) measured 1 mm in thickness. (c-ii) Histological analysis of specimen 2 (200×) with H&E stain highlights giant cells with cholesterol cleft representing severe lipid and cholesterol corresponds to the PAT image for 1235 nm (triglyceride). (d) A single PA signal (A-line) captured with an oscilloscope; (e) an A-line is captured when the CIRPI probe is placed in close proximity of 0.8 µm of the human carotid atherosclerotic plaque. Figure 5 is already published in the SNMMI Annual Conference Abstract.
Figure 6
Figure 6
Correlation between CIRPI images and histochemical measurements of plaque compositions are computed using the Pearson product-moment correlation coefficient. A p-value of less than 0.01 was considered statistically significant. Each composition is identified based on their depth in mm. The Pearson correlation coefficients of calcification (R2 = 0.97, p < 10−5), cholesterol ester (R2 = 0.86, p < 10−5), phospholipids (R2 = 0.94, p < 10−5), elastin/collagen (R2 = 0.97, p < 10−5), cholesterol (R2 = 0.89, p < 10−5), triglyceride (R2 = 0.92, p < 10−5) illustrated a strong linear relationship between the CIRPI and the histochemical analysis. However, for the macrophages we found the strongest linear correlation (R2 = 1, p < 10−5).

Similar articles

Cited by

References

    1. Garcia-Garcia HM, Costa MA, Serruys PW. Imaging of coronary atherosclerosis: intravascular ultrasound. Eur Heart J. 2010;31:2456–2469. doi: 10.1093/eurheartj/ehq280. - DOI - PubMed
    1. Chen IY, Wu JC. Cardiovascular molecular imaging: focus on clinical translation. Circulation. 2011;123:425–443. doi: 10.1161/CIRCULATIONAHA.109.916338. - DOI - PMC - PubMed
    1. Jang IK, et al. In vivo characterization of coronary atherosclerotic plaque by use of optical coherence tomography. Circulation. 2005;111:1551–1555. doi: 10.1161/01.CIR.0000159354.43778.69. - DOI - PMC - PubMed
    1. Yabushita H, et al. Characterization of human atherosclerosis by optical coherence tomography. Circulation. 2002;106:1640–1645. doi: 10.1161/01.CIR.0000029927.92825.F6. - DOI - PubMed
    1. Jansen K, Wu M, van der Steen AFW, van Soest G. Photoacoustic imaging of human coronary atherosclerosis in two spectral bands. Photoacoustics. 2014;2:12–20. doi: 10.1016/j.pacs.2013.11.003. - DOI - PMC - PubMed

Publication types

MeSH terms

Substances