Exploring the Relationship between Blood Flux Signals and HRV following Different Thermal Stimulations using Complexity Analysis
- PMID: 29895975
- PMCID: PMC5997638
- DOI: 10.1038/s41598-018-27374-5
Exploring the Relationship between Blood Flux Signals and HRV following Different Thermal Stimulations using Complexity Analysis
Erratum in
-
Author Correction: Exploring the Relationship between Blood Flux Signals and HRV following Different Thermal Stimulations using Complexity Analysis.Sci Rep. 2018 Jul 11;8(1):10753. doi: 10.1038/s41598-018-29003-7. Sci Rep. 2018. PMID: 29993028 Free PMC article.
Abstract
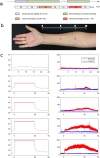
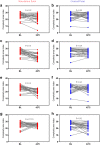
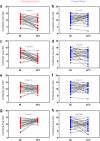
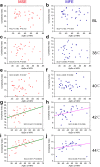
To investigate the relationship between local blood flux and heart rate variability following different thermal stimulations, healthy subjects were recruited and subject to different thermal stimulations on the right forearm. Multiscale entropy and multiscale fuzzy entropy were used to measure the complexity of the local blood flux, and the approximate entropy was calculated to evaluate the HRV complexity. The results indicated that thermal stimulation significantly increased local blood flux and that different temperature stimulations resulted in different complexities in local blood flux. A 42 °C or 44 °C thermal stimulation, other than stimulations below 42 °C, resulted in a moderate correlation between local blood flux and heart rate variability complexity. The results provide a new perspective in terms of complexity to explore the relationship between skin blood flux signals and cardiac function.
Conflict of interest statement
The authors declare no competing interests.
Figures


Similar articles
-
The Relationship Between Blood Perfusion in the Lower Extremities and Heart Rate Variability at Different Positions.Front Physiol. 2021 Aug 13;12:656527. doi: 10.3389/fphys.2021.656527. eCollection 2021. Front Physiol. 2021. PMID: 34483950 Free PMC article.
-
Exploring the relationship between the speed-resolved perfusion of blood flux and HRV following different thermal stimulations using MSE and MFE analyses.PLoS One. 2019 Jun 5;14(6):e0217973. doi: 10.1371/journal.pone.0217973. eCollection 2019. PLoS One. 2019. PMID: 31167001 Free PMC article. Clinical Trial.
-
Analysis of microvascular blood flow and oxygenation: Discrimination between two haemodynamic steady states using nonlinear measures and multiscale analysis.Comput Biol Med. 2018 Nov 1;102:157-167. doi: 10.1016/j.compbiomed.2018.09.026. Epub 2018 Sep 26. Comput Biol Med. 2018. PMID: 30286411
-
Impact of local thermal stimulation on the correlation between oxygen saturation and speed-resolved blood perfusion.Sci Rep. 2020 Jan 13;10(1):183. doi: 10.1038/s41598-019-57067-6. Sci Rep. 2020. PMID: 31932611 Free PMC article.
-
An adaptive technique for multiscale approximate entropy (MAEbin) threshold (r) selection: application to heart rate variability (HRV) and systolic blood pressure variability (SBPV) under postural stress.Australas Phys Eng Sci Med. 2016 Jun;39(2):557-69. doi: 10.1007/s13246-016-0432-3. Epub 2016 Mar 3. Australas Phys Eng Sci Med. 2016. PMID: 26939777
Cited by
-
The Effect of Moxibustion Stimulation on Local and Distal Skin Temperature in Healthy Subjects.Evid Based Complement Alternat Med. 2019 Apr 2;2019:3185987. doi: 10.1155/2019/3185987. eCollection 2019. Evid Based Complement Alternat Med. 2019. PMID: 31061669 Free PMC article.
-
The Relationship Between Blood Perfusion in the Lower Extremities and Heart Rate Variability at Different Positions.Front Physiol. 2021 Aug 13;12:656527. doi: 10.3389/fphys.2021.656527. eCollection 2021. Front Physiol. 2021. PMID: 34483950 Free PMC article.
-
Enhanced flow-motion complexity of skin microvascular perfusion in Sherpas and lowlanders during ascent to high altitude.Sci Rep. 2019 Oct 7;9(1):14391. doi: 10.1038/s41598-019-50774-0. Sci Rep. 2019. PMID: 31591502 Free PMC article.
-
Pilot Study of Blood Perfusion Changes at PC4 and Its Surrounding Points Induced by Acupuncture and Moxibustion.Evid Based Complement Alternat Med. 2021 Nov 26;2021:2431570. doi: 10.1155/2021/2431570. eCollection 2021. Evid Based Complement Alternat Med. 2021. PMID: 34868329 Free PMC article.
-
Exploring the relationship between the speed-resolved perfusion of blood flux and HRV following different thermal stimulations using MSE and MFE analyses.PLoS One. 2019 Jun 5;14(6):e0217973. doi: 10.1371/journal.pone.0217973. eCollection 2019. PLoS One. 2019. PMID: 31167001 Free PMC article. Clinical Trial.
References
-
- Li L, et al. [Effect of moxibustion-like thermal stimulation with different temperature and covering different areas of “zhongwan” (CV 12) on discharges of neurons in medullary subnucleus reticularis dorsalis of rats] Zhen Ci Yan Jiu. 2011;36:313–320. - PubMed
Publication types
MeSH terms
LinkOut - more resources
Full Text Sources
Other Literature Sources

