. 2018 Jun 12;8(1):8926.
doi: 10.1038/s41598-018-27281-9.

The P2X7 receptor and pannexin-1 are involved in glucose-induced autocrine regulation in β-cells

Affiliations

The P2X7 receptor and pannexin-1 are involved in glucose-induced autocrine regulation in β-cells

Marco Tozzi et al. Sci Rep. .

Abstract

Extracellular ATP is an important short-range signaling molecule that promotes various physiological responses virtually in all cell types, including pancreatic β-cells. It is well documented that pancreatic β-cells release ATP through exocytosis of insulin granules upon glucose stimulation. We hypothesized that glucose might stimulate ATP release through other non-vesicular mechanisms. Several purinergic receptors are found in β-cells and there is increasing evidence that purinergic signaling regulates β-cell functions and survival. One of the receptors that may be relevant is the P2X7 receptor, but its detailed role in β-cell physiology is unclear. In this study we investigated roles of the P2X7 receptor and pannexin-1 in ATP release, intracellular ATP, Ca2+ signals, insulin release and cell proliferation/survival in β-cells. Results show that glucose induces rapid release of ATP and significant fraction of release involves the P2X7 receptor and pannexin-1, both expressed in INS-1E cells, rat and mouse β-cells. Furthermore, we provide pharmacological evidence that extracellular ATP, via P2X7 receptor, stimulates Ca2+ transients and cell proliferation in INS-1E cells and insulin secretion in INS-1E cells and rat islets. These data indicate that the P2X7 receptor and pannexin-1 have important functions in β-cell physiology, and should be considered in understanding and treatment of diabetes.


Conflict of interest statement

The authors declare no competing interests.

Figures

Figure 1
Figure 1
Expression of P2X7R and Panx1 in INS-1E cells. (a) Representative gel of P2X7 and Panx1 mRNA expression. (b) Representative Western blot of P2X7R and Panx1 expression in INS-1E cells grown in increasing glucose concentrations. Loading control was β-actin. The images (in a and b) are cropped from original full-length gels and blots that are shown in the supplementary material. (c,d) Western blot quantification of P2X7R and Panx1 (isoform A and D) expression in INS-1E cells grown in increasing glucose concentrations. The ratio of protein (P2X7R or Panx1) to β-actin were normalized to 2.8 mM glucose. Data represent means ± s.e.m. and n denotes the number of independent experiments and significant differences *p < 0.05 and **p < 0.01 are indicated.
Figure 2
Figure 2
Immunolocalization of P2X7R and Panx1 in INS-1E cells, rat and mouse pancreas. Overlay images of INS-1E cells stained for P2X7R (a–d) and Panx1 (e–h) (green), insulin (red) and nuclei were stained with DAPI (blue). Co-localization graphs (d,h) show co-localization of P2X7R or Panx1 and insulin in corresponding images to the left (c,g). Person’s coefficient was x and y. Arrows indicate localization of the two proteins in the plasma membrane. Rat pancreas (i,j) and mouse pancreas (k,l) was stained for P2X7R (i,k) or Panx1 (j,l) (green) as above. All bars are 25 µm. Images shown here are representative of 3–10 images per slide on 3–9 independent staining experiments.
Figure 3
Figure 3
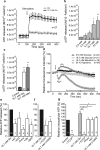
Effect of glucose, mannitol, metabolic and transport inhibitors on ATP release and intracellular ATP. (a) The time-course of ATP release after stimulation with 16.7 mM glucose and corresponding control (5.5 mM glucose). The arrow indicates stimulus application. (b) ATP released in response to increasing glucose concentrations shown as the difference between the basal extracellular ATP (in 2.8 mM glucose) and the peak release with the indicated glucose concentrations. (c) ATP release in response to high glucose (Glu) and mannitol (Man). The control glucose concentration was 5.5 mM and data show the difference in extracellular ATP before and after stimulation with the indicated factors. (d) Cell volume was measured as relative fluorescence intensity of calcein. The arrow indicates stimulation with 5.5 mM glucose, 16.7 mM glucose, 16.7 mM mannitol or hypotonic solutions. A decrease in fluorescence intensity indicates cell volume increases. Responses in each cell were normalized to the average of the baseline and corrected for bleaching. (e,f) The difference in extracellular ATP before and after stimulation with 16.7 mM glucose alone or in combination with a pre-treatment with the indicated inhibitors: AZ10606120 (10 μM), A438079 (10 μM), 10Panx (100 μM), glyoxylate (50 μM), bafilomycin A (1 μM), FCCP (5 μM) or 3-O-methylglucose. (h) Intracellular ATP was measured in cells incubated with 5.5 mM glucose (control) or 16.7 mM glucose with or without inhibitors as indicated. Data are normalized to the response with 16.7 mM glucose. All data are shown as mean values ± s.e.m. and significance is indicated *p < 0.05 and **p < 0.01.
Figure 4
Figure 4
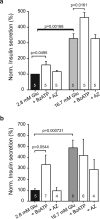
Role of P2X7R on insulin secretion in INS1-E cells and pancreatic islets. (a) Data show the effect of the P2X7R agonist BzATP (10 μM) or AZ10606120 (10 μM) on 30 min insulin secretion in INS1-E cells. Data are normalized to 2.8 mM glucose and show mean values ± s.e.m. of indicated number of independent experiments, and p-values are indicated. (b) Insulin secretion from pancreatic islets during 30 min stimulation with glucose, BzATP (10 μM) or AZ10606120 (10 μM). Data are normalized to 2.8 mM glucose and show mean values ± s.e.m. of the indicated number of experiments, and p-values are indicated.
Figure 5
Figure 5
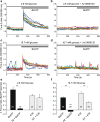
Effect of P2X7R and glucose on calcium transients. Representative recordings of intracellular Ca2+ (given as Fura-2 ratio) in INS-1E cells stimulated with BzATP (10 μM). (a) BzATP induced synchronous Ca2+ peaks in 2.8 mM glucose solutions. (b) This response was abolished by short pre-treatment with the P2X7R inhibitor (AZ10606120, 10 μM). (c) In high glucose (16.7 mM) many cells showed Ca2+ oscillations and BzATP induced synchronized Ca2+ peak. (d) Pre-treatment with AZ10606120 abolished the Ca2+ peak response. Each graph shows responses of 10 cells/experiment and each experiment was performed 3–4 times. (e,f) Bargraphs show the peak change means ± s.e.m. in fura-2 ratio in response to BzATP with/without pre-treatment with AZ10606120 (10 μM) for the two glucose concentrations indicated. The graph also shows the responses to a depolarizing K+ step (30 mM), which was carried out at the end of most experiments. Numbers indicate the number of cells analyzed in 3–4 independent experiments. Significant differences, **p < 0.01, are indicated.
Figure 6
Figure 6
Effect of apyrase and AZ10606120 on glucose-induced calcium transients. (a) Increase in glucose (from 2.8 to 16.7 mM) induced calcium oscillations in many cells and these were reduced by introduction of apyrase (10 U/ml). BzATP (100 μM) had no, if any, effect while increase in K+ to 30 mM caused further increase in intracellular Ca2+. (c) Similar protocol as in (a) but instead of apyrase AZ10606120 (10 μM) was added to the bath. Oscillations in Ca2+ abated and Fura-2 ratio increased until medium was exchanged with fresh low glucose solution. (b, d) Bargraphs shows means ± s.e.m. of height of Ca2+ oscillations in 2.8 mM, 16.7 mM glucose with/without apyrase (b) or AZ10606120 (d). Numbers indicate the number of cells analyzed in 5 and 4 independent experiments, respectively. Significant differences, **p < 0.01, are indicated.
Figure 7
Figure 7
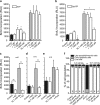
Effect of P2X7R on cell proliferation and viability. Data show cell proliferation measured by BrdU incorporation after 24 h. The black and grey bars show the effect of glucose alone and the white columns show the effect of increasing concentrations of ATP or BzATP. The control is 5.5 mM glucose. (a,b) Effect of exogenous ATP and the P2X7R agonist BzATP on cell proliferation. (c–e) Effect of the P2X7R inhibitors AZ10602120 (10 μM) and A438079 (10 μM), and pannexin-1 inhibitor 10Panx on cell proliferation at 5.5 mM and 16.7 mM glucose. (f) Cell viability was assayed by FACS analysis with Annexin V as apoptotic marker and propidium iodide as marker for necrotic or dead cells. Cells were incubated for 24 h with 5.5 mM or 16.7 mM of glucose in combination with the AZ10606120, A438079 or BzATP. AT101 (apoptotic inducer) was included as control. Representative FACS plots are shown in Supplementary Fig. 2. The bars show means ± s.e.m. of the percentage of cells in the indicated populations for 4–5 experiments. Late apoptotic and necrotic cells are shown as one population. Data represent means ± s.e.m. and n denotes the number of independent experiments and significant differences *p < 0.05 and **p < 0.01 are indicated.
Figure 8
Figure 8
Cell model for autocrine purinergic signaling in β-cells. Glucose enters the cell and is metabolized to ATP. On left side of the cell (in blue) we show the well-established events: closure of ATP-sensitive K+ channels leading to cell membrane depolarization, opening of voltage-sensitive Ca2+ channels and influx of Ca2+ that triggers exocytosis of insulin-containing granules. Granules also contain ATP which is accumulated by VNUT. Our study on INS-1E cells shows (in green) that ATP is also released via pannexin-1 (Panx1) and the process is regulated by the P2X7R. Extracellular ATP binds to the receptor and causes further influx of Ca2+ and potentiation of insulin secretion. The resulting amplification of the Ca2+ signal promotes additional exocytosis of secretory granules. The P2X7 receptor also regulates β-cell proliferation/survival. ATP can also be released by cell volume/stress, but since these have no effect on cell proliferation, one or more of the steps in the glucose uptake – metabolism – Panx1 - P2X7R – chain are missing.

Similar articles

Cited by

References

    1. Burnstock G, Novak I. Purinergic signalling and diabetes. Purinergic. Signal. 2013;9:307–324. doi: 10.1007/s11302-013-9359-2. - DOI - PMC - PubMed
    1. Leitner JW, Sussman KE, Vatter AE, Schneider FH. Adenine nucleotides in the secretory granule fraction of rat islets. Endocrinology. 1975;96:662–677. doi: 10.1210/endo-96-3-662. - DOI - PubMed
    1. Hutton JC, Penn EJ, Peshavaria M. Low-molecular-weight constituents of isolated insulin-secretory granules. Bivalent cations, adenine nucleotides and inorganic phosphate. Biochem J. 1983;210:297–305. - PMC - PubMed
    1. Braun M, et al. Corelease and differential exit via the fusion pore of GABA, serotonin, and ATP from LDCV in rat pancreatic beta cells. J. Gen. Physiol. 2007;129:221–231. doi: 10.1085/jgp.200609658. - DOI - PMC - PubMed
    1. Hazama A, Hayashi S, Okada Y. Cell surface measurements of ATP release from single pancreatic beta cells using a novel biosensor technique. Pflugers Arch. 1998;437:31–35. doi: 10.1007/s004240050742. - DOI - PubMed

Publication types

MeSH terms

LinkOut - more resources