. 2018 Apr 30;9(11):1989-2002.
doi: 10.7150/jca.23762. eCollection 2018.

Development Of A Three-Gene Prognostic Signature For Hepatitis B Virus Associated Hepatocellular Carcinoma Based On Integrated Transcriptomic Analysis

Affiliations

Development Of A Three-Gene Prognostic Signature For Hepatitis B Virus Associated Hepatocellular Carcinoma Based On Integrated Transcriptomic Analysis

Yao Yang et al. J Cancer. .

Abstract

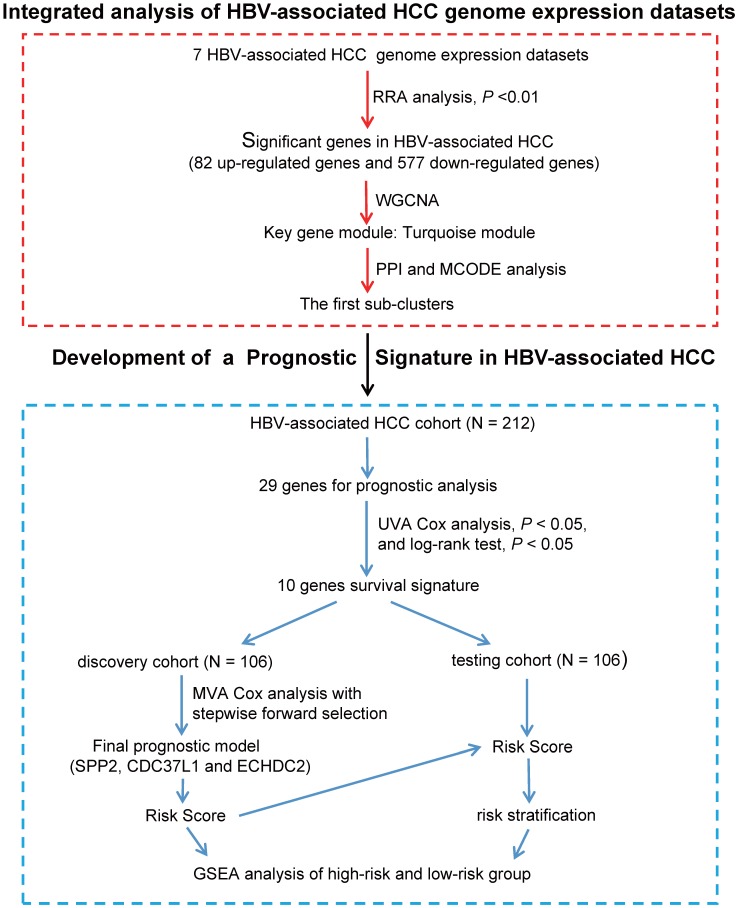
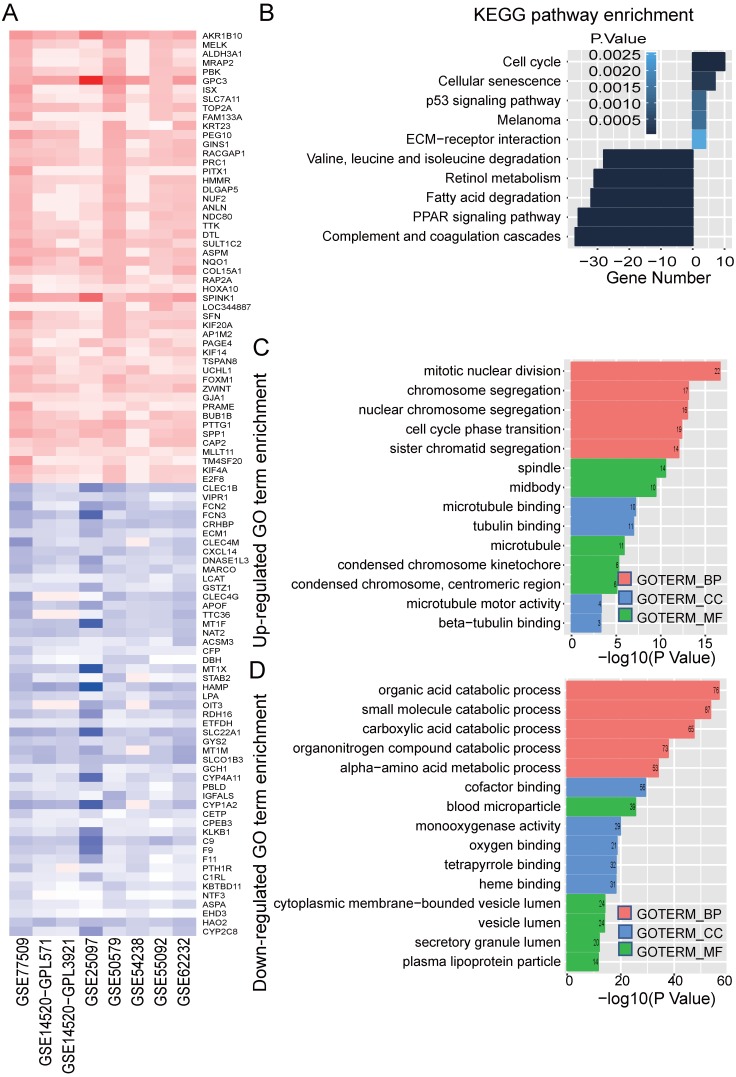
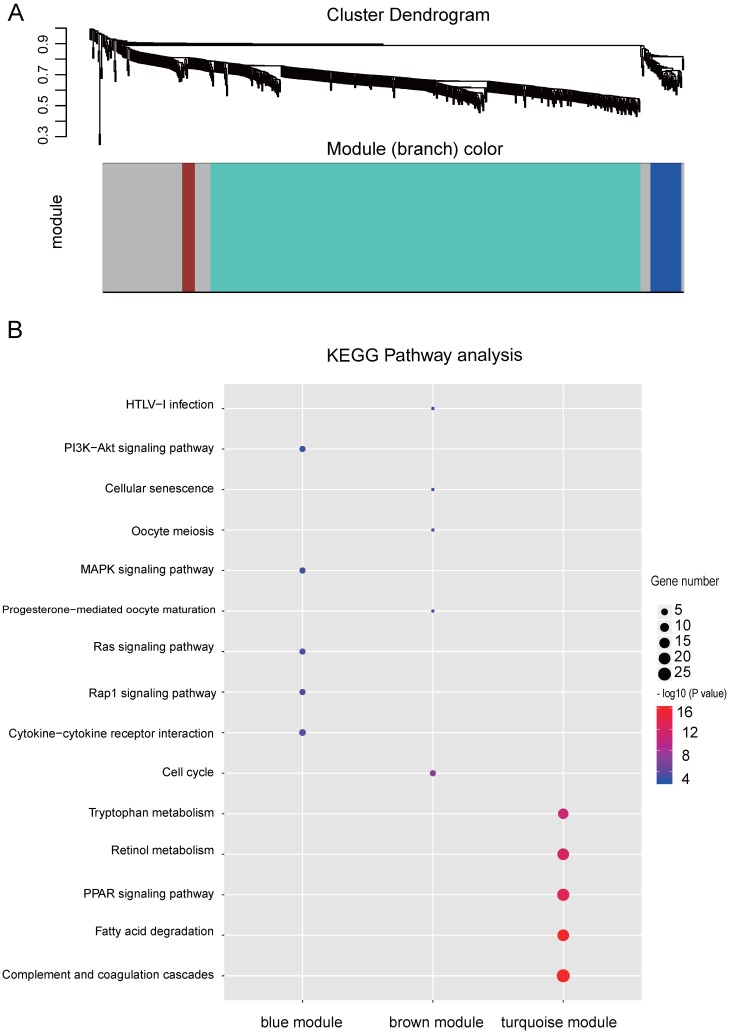
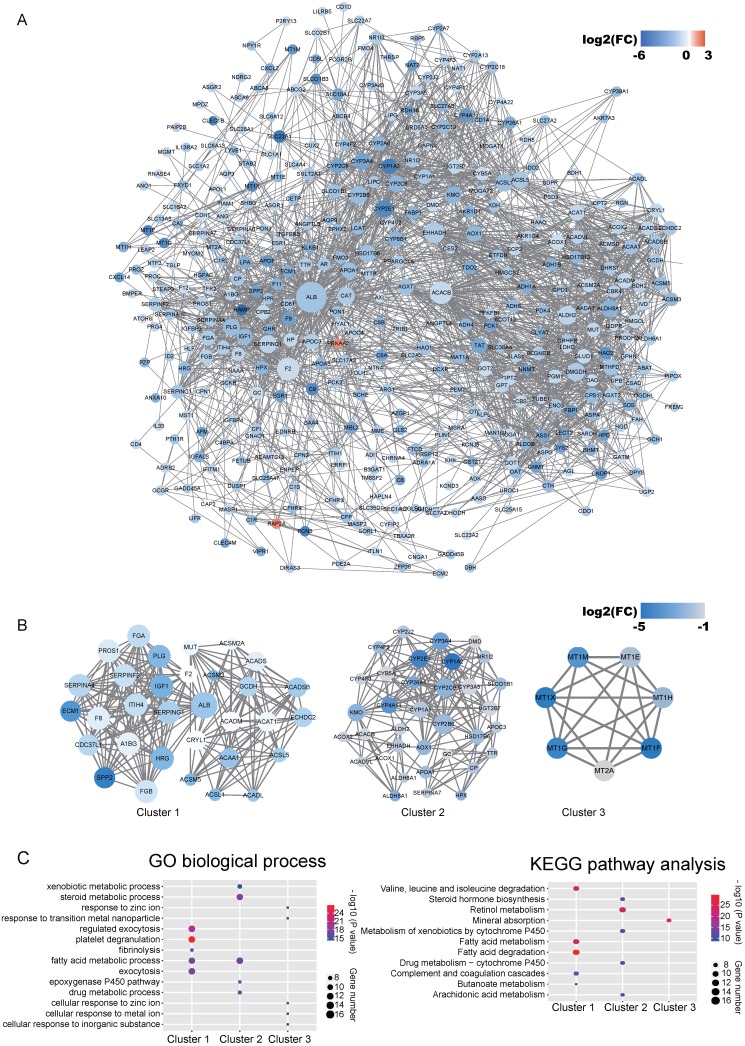
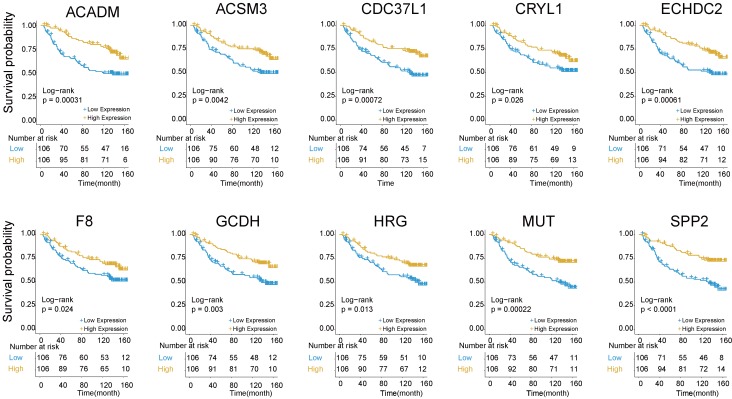
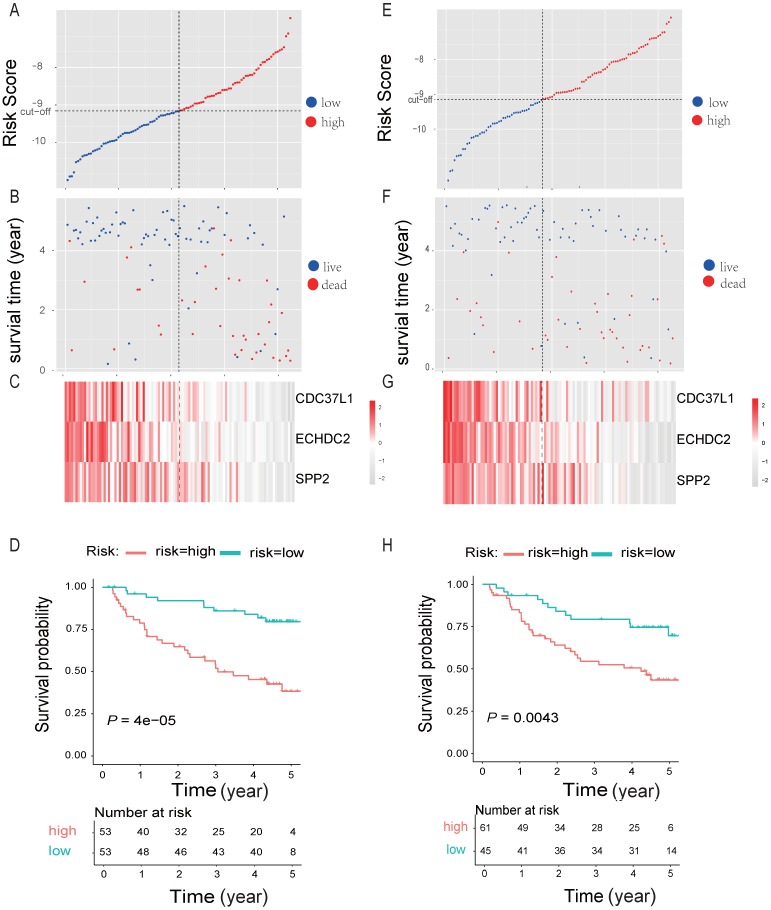
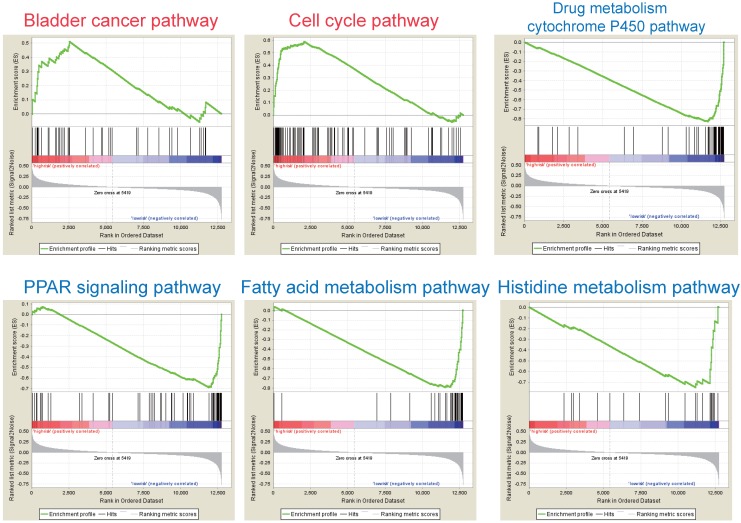
Integration of public genome-wide gene expression data together with Cox regression analysis is a powerful weapon to identify new prognostic gene signatures for cancer diagnosis and prognosis. Hepatitis B virus (HBV) is a major cause of hepatocellular carcinoma (HCC), however, it remains largely unknown about the specific gene prognostic signature of HBV-associated HCC. Using Robust Rank Aggreg (RRA) method to integrate seven whole genome expression datasets, we identified 82 up-regulated genes and 577 down-regulated genes in HBV-associated HCC patients. Combination of several enrichment analysis, univariate and multivariate Cox proportional hazards regression analysis, we revealed that a three-gene (SPP2, CDC37L1, and ECHDC2) prognostic signature could act as an independent prognostic indicator for HBV-associated HCC in both the discovery cohort and the internal testing cohort. Gene set enrichment analysis showed that the high-risk group with lower expression levels of the three genes was enriched in bladder cancer and cell cycle pathway, whereas the low-risk group with higher expression levels of the three genes was enriched in drug metabolism-cytochrome P450, PPAR signaling pathway, fatty acid and histidine metabolisms. This indicates that patients of HBV-associated HCC with higher expression of these three genes may preserve relatively good hepatic cellular metabolism and function, which may also protect HCC patients from persistent drug toxicity in response to various medication. Our findings suggest a three-gene prognostic model that serves as a specific prognostic signature for HBV-associated HCC.

Keywords: Hepatitis B virus associated hepatocellular carcinoma; Hub genes; Overall survival.; Prognostic signature; Robust Rank Aggreg analysis.


Conflict of interest statement

Competing Interests: The authors have declared that no competing interest exists.

Figures

Figure 1
Figure 1
Flowchart describing the schematic overview of the study design. After integrated analysis and different bioinformatics analysis of HBV-associated HCC genome expression datasets, we identified hub genes in Cluster 1. Hub genes were then analyzed individually for prognostic significance by univariate Cox proportional hazards and Kaplan-Meier survival analysis. 10 hub genes were significantly associated with the survival of patients with HBV-associated HCC (UVA Cox analysis, P < 0.05, and log-rank test P < 0.05). The HBV-associated HCC cohort (GSE14520, N = 212) were randomly divided in to discovery cohort (N = 106) and internal testing cohort (N = 106). Next, we used multivariable Cox proportional hazards stepwise regression analysis with forward selection to build a prognostic model that included 3 genes: SPP2, ECHDC2, and CDC37L1. This model was used to calculate risk scores for discovery cohort (risk score = expSPP2* - 0.1941 + expCDC37L1* - 0.5466 + expECHDC2* - 0.4714), and the cut-off point was chosen. This risk score calculation and cut-off point were further validated in internal testing cohort. Lastly, GSEA analysis of the high-risk and low-risk group was used to further inquiry the 3 genes prognostic signature. UVA Cox: univariate Cox; MVA Cox: multivariate Cox.
Figure 2
Figure 2
Identified significance genes and enrichment analysis. (A) Heatmap showed the fold change of the top 100 significantly genes in different studies (50 up-regulated genes and 50 down-regulated genes) by Robust Rank Aggreg (RRA) methods from 7 different datasets. Each row represents the same mRNA and each column represents the same study. The fold change intensity of each mRNA in one study is represented in shade of red or blue. Red represents the fold change of up-regulated genes and blue represents the fold change of down-regulated genes, respectively, in comparison to non-tumor tissues. (B) Kyoto Encyclopedia of Genes and Genomes (KEGG) enrichment analysis of the significant genes. Up-regulated KEGG pathways are showed with horizontal axis > 0, and down-regulated genes are showed with horizontal axis < 0, respectively. The size of the horizontal axis shows the numbers of enriched genes in each KEGG pathway and the color shade of bar reflects P value. (C-D) Gene Ontology (GO) enrichment analysis of up-regulated (C) and down-regulated genes (D). The vertical and horizontal axes represent GO term and -log10 (P value) of the corresponding GO term, respectively. The number in each bar reflects the enriched gene number of each GO term. Different colors reflect main categories of GO terms: BP, biological process; CC, cellular component; MF, molecular function.
Figure 3
Figure 3
WGCNA analysis of the significant genes and KEGG analysis of the key modules from WGCNA. (A) Gene clustering and module identification by WGCNA analysis based on the dataset of GSE77509. Top: clustering dendrogram showed the result of hierarchical clustering, and each line represents one gene. Bottom: the colored row below the dendrogram indicates module membership identified by the static tree cutting method. Different color represents different co-expression network modules for the significantly genes. (B) KEGG analysis of the top three modules from WGCNA. The vertical and horizontal axes represent the KEGG pathways and different modules, respectively. The size and the color intensity of a circle represent gene number and -log10 (P value), respectively.
Figure 4
Figure 4
Identified discrete clusters and enrichment analysis of the turquoise module in Figure 3. (A) PPI network of genes in the turquoise module. The color intensity in each node represents the fold change of the gene in comparison to non-tumor samples (up-regulation of a gene is shown in red and down-regulation of a gene is shown in blue). The size of the circle is proportional to the score of PPI based on the STRING database. (B) Main sub-clusters from the master PPI networks. The color intensity in each node was proportional to fold change of each gene expression in comparison to non-tumor samples (up-regulation in red and down-regulation in blue). (C) KEGG and GO enrichment analysis of the top three sub-clusters. The vertical and horizontal axes represent the GO biological process /KEGG pathways and different sub-clusters, respectively. The size and the color intensity of a circle represent gene number and -log10 (P value), respectively.
Figure 5
Figure 5
Kaplan-Meier survival plots of the association between the expression levels of hub genes and overall survival probability in patients of HBV-associated HCC. P values were obtained from Log-rank test. Yellow and blue line represent the samples with the gene higher expressed and lower expressed, respectively. The table below the Kaplan-Meier survival plots showed the number of patients at the risk. Abbreviations: ACADM, acyl-CoA dehydrogenase, C-4 To C-12 straight chain; ACSM3, acyl-coA synthetase medium-chain family member 3; CDC37L1, cell division cycle 37 like 1; CRYL1, crystallin lambda 1; ECHDC2, enoyl-CoA hydratase domain containing 2; F8, coagulation factor VIII; GCDH, glutaryl-CoA dehydrogenase; HRG, histidine rich glycoprotein; MUT, methylmalonyl-CoA mutase; SPP2, secreted phosphoprotein 2.
Figure 6
Figure 6
Three-gene predictor-score analysis of HBV-associated HCC patients in both the discovery and internal cohort. (A) and (E) Three-gene risk score distribution in both the discovery (A) and internal testing cohort (E), respectively. Each point represents one patient; the vertical and horizontal axes represent the risk score calculated from the three-genes model and results sorted by the size of the risk score, respectively; red and blue represent patients with high and low risk scores identified by cut-off, respectively. The black dotted line represents the median mRNA risk score cut-off dividing patients into low-risk or high-risk groups. (B) and (F) Patients' survival status and time in both the discovery (B) and internal testing cohort (F), respectively. Each point corresponds to the same patient as above; the vertical and horizontal axes represent the survival time and results sorted by the size of the risk score, respectively; red or blue represent patient dead or live in the end, respectively. (C) and (G) Heatmap of gene expression profiles in both the discovery (C) and internal testing cohort (G), respectively. Each row represents the same gene and each column represents the same patient corresponded to the above point. The expression intensity of each gene in one patient is represented in shade of red or grey, indicating its expression level above or below the median expression intensity across all patients, respectively. (D) and (H) The Kaplan-Meier overall survival plots for HBV-associated HCC risk groups obtained from both the discovery (D) and internal testing cohort (H), respectively. Red and green line represent the patient with high or low risk, respectively.
Figure 7
Figure 7
GSEA analysis of the three prognostic genes. GSEA analysis of the differentially expressed genes between the high-risk versus low-risk group. Only two significantly functional gene sets were enriched for high-risk group (marked in red), whereas only four most significantly enriched functional gene sets were listed for low-risk group (markered in blue) in HBV-associated HCC samples.

References

    1. Chibon F. Cancer gene expression signatures - the rise and fall? Eur J Cancer. 2013;49:2000–9. - PubMed
    1. Rung J, Brazma A. Reuse of public genome-wide gene expression data. Nat Rev Genet. 2013;14:89–99. - PubMed
    1. Jemal A, Bray F, Center MM, Ferlay J, Ward E, Forman D. Global cancer statistics. CA Cancer J Clin. 2011;61:69–90. - PubMed
    1. Zucman-Rossi J, Villanueva A, Nault J, Llovet J. Genetic Landscape and Biomarkers of Hepatocellular Carcinoma. Gastroenterology. 2015;149:1226–39.e4. - PubMed
    1. Hoshida Y, Moeini A, Alsinet C, Kojima K, Villanueva A. Gene signatures in the management of hepatocellular carcinoma. Semin Oncol. 2012;39:473–85. - PubMed

LinkOut - more resources