Review
. 2018 Apr 18;8(11):2954-2973.
doi: 10.7150/thno.24108. eCollection 2018.

Multimodality reporter gene imaging: Construction strategies and application

Affiliations
Review

Multimodality reporter gene imaging: Construction strategies and application

Mengting Li et al. Theranostics. .

Abstract

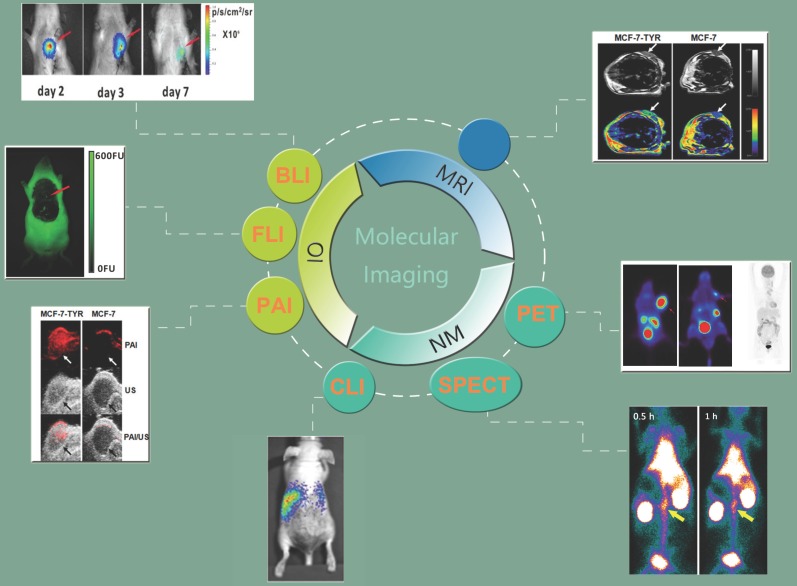
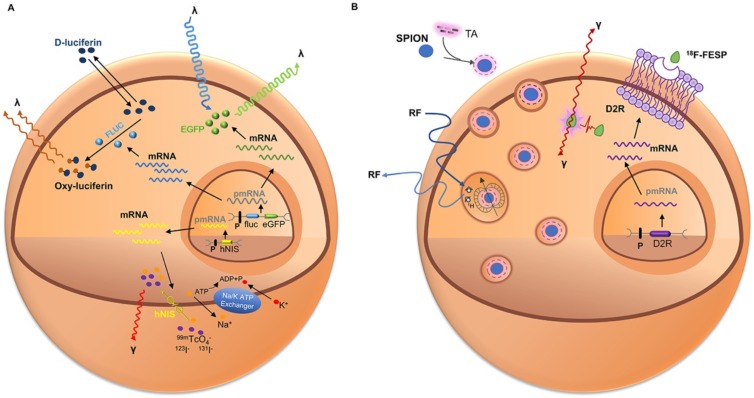
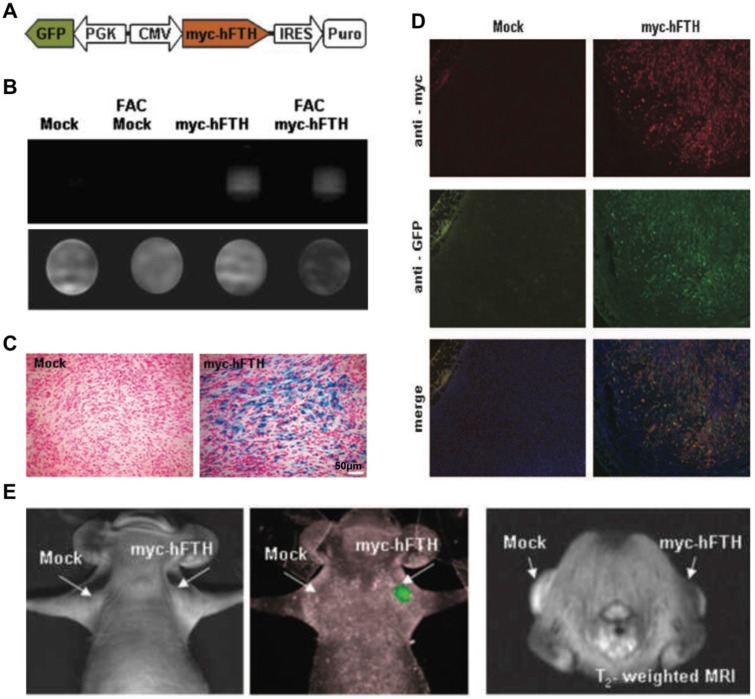
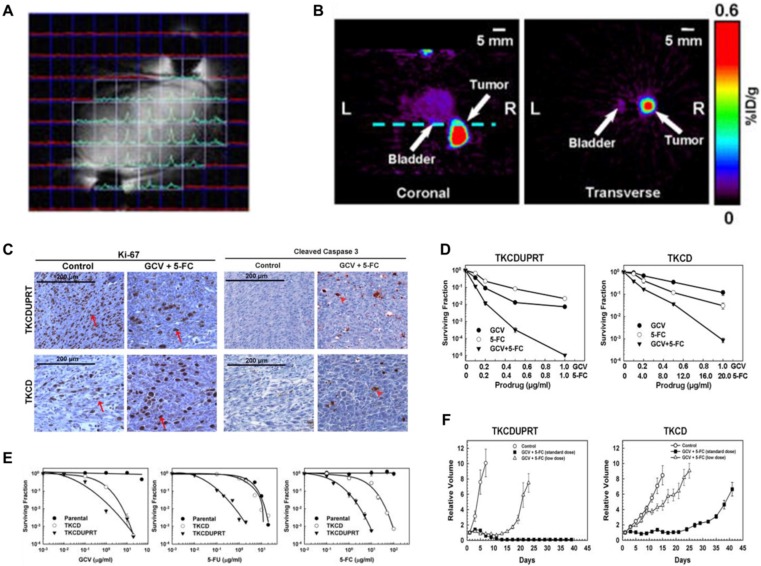
Molecular imaging has played an important role in the noninvasive exploration of multiple biological processes. Reporter gene imaging is a key part of molecular imaging. By combining with a reporter probe, a reporter protein can induce the accumulation of specific signals that are detectable by an imaging device to provide indirect information of reporter gene expression in living subjects. There are many types of reporter genes and each corresponding imaging technique has its own advantages and drawbacks. Fused reporter genes or single reporter genes with products detectable by multiple imaging modalities can compensate for the disadvantages and potentiate the advantages of each modality. Reporter gene multimodality imaging could be applied to trace implanted cells, monitor gene therapy, assess endogenous molecular events, screen drugs, etc. Although several types of multimodality imaging apparatus and multimodality reporter genes are available, more sophisticated detectors and multimodality reporter gene systems are needed.

Keywords: cell tracing; drug screening; gene directed therapy; molecular imaging; multimodality imaging; reporter gene.


Conflict of interest statement

Competing Interests: The authors have declared that no competing interest exists.

Figures

Figure 1
Figure 1
Schematic diagram of molecular imaging techniques, including nuclear modalities such as positron emission tomography (PET) , (Adapted with permission from , copyright 2017 ACS Publications) (Adapted with permission from , copyright 2017 Wolters Kluwer Health) and single photon emission computed tomography (SPECT) (Adapted with permission from , copyright 2016 Elsevier), magnetic resonance imaging (MRI) (Adapted with permission from , copyright 2013 Nature Publishing Group), optical imaging (OI) such as bioluminescence imaging (BLI) and fluorescence imaging (FLI) (Adapted with permission from , copyright 2014 Public Library of Science), photoacoustic imaging (PAI) (Adapted with permission from , copyright 2013 Nature Publishing Group), and Cerenkov luminescence imaging (CLI) (Adapted with permission from , copyright 2014 American Association for Cancer Research).
Figure 2
Figure 2
Schematic of common approaches for molecular imaging in vivo. For direct labeling (left), imaging probes may enter the cell via endocytosis (i.e., SPIOs, USPIOs and Au NPs), transporter uptake (i.e., 18F-FDG), or passive diffusion (i.e., 111In-ox) and may bind to the cell surface through antigen - antibody or ligand - receptor recognition (i.e., microbubbles). Labeled cells are then detected by imaging systems such as PET, SPECT, MRI, CT, and ultrasound. In reporter gene imaging (right), genetic modification of cells utilizes reporter gene integration. Target cells are transduced or transfected with a multimodality reporter gene construct. Transcription of the reporter gene under the control of a promoter is followed by translation of its mRNA, leading to accumulation of reporter proteins such as enzymes (i.e., HSV1-tk, RLuc, FLuc, and eGFP), receptors (i.e., D2R), and transporter proteins (i.e., hNIS). Abbreviations: Au NP: Au nanoparticle; CT: computed tomography; D2R: dopamine D2 receptor; eGFP: enhanced green fluorescent protein; 18F-FDG: 18F-fluorodeoxyglucose; Fluc: firefly luciferase; hNIS: human sodium-iodine symporters. HSV1-tk: herpes simplex virus type-1; RLuc: Renilla luciferase; SPIO: superparamagnetic iron oxide; USPIO: ultrasmall superparamagnetic iron oxide.
Figure 3
Figure 3
Schematic of promoter-reporter gene constructs strategies. P1 and P2 represent promoter/enhancer sequences; Gene1 and Gene2 are reporter genes; IRES is internal ribosomal entry site.
Figure 4
Figure 4
Multimodality reporter gene imaging strategies. (A) Reporter gene strategy: Expression of the enhanced green fluorescent protein reporter gene (eGFP) leads to cytosolic retention of enhanced green fluorescent protein (EGFP), which emits fluorescent light (green λ) when excited with a light source (blue λ). Transcription of the firefly luciferase gene (fLuc), followed by its translation, leading to accumulation of firefly luciferase enzyme (FLuc) that catalyzes a photochemical reaction when its substrate D-luciferin is present. The resultant fluorescent light (brown λ) emission can be detected by a charge-coupled device camera. Furthermore, the human sodium iodide symporter (hNIS) transporter is able to transport radioactive forms of iodide, as well as other anions such as technetium pertechnetate (99mTcO4-); then the decay of the radionuclide is detected using SPECT. (B) Reporter gene and contrast agents combination strategy: Cells are genetically modified with the reporter gene(s) and labeled with imaging probes. The dopamine 2 receptor (D2R) gene complex is transfected into target cells by a vector. Inside the transfected cell, the D2R gene is transcribed to D2R mRNA and then translated to a protein (receptor). After introduction of radiolabeled probes (i.e., 18F-FESP) and recognition of the receptors, the radiolabeled substrate is trapped within the cells. The accumulation of the probe gives rise to a radioactive signal. Also, the target cells are incubated with SPIO particles that are taken up by nonspecific endocytosis. Protons surrounding each SPIO emit a radiofrequency pulse after excitation that is detected by MRI. Abbreviations: 18F-FESP: 3-(2′-[18F]-fluoroethyl)-spiperone; I: iodine; RF: radio frequency; SPIONs: superparamagnetic iron oxide nanoparticles; 99mTcO4-: technetium pertechnetate.
Figure 5
Figure 5
(A) Dual-reporter gene structure diagram. BLI in (B) for luc expression and microPET in (C) for tk expression of a positive and negative control. (A-C adapted with , copyright 2012 Ivyspring International Publisher) (D) 123I-FIAU SPECT/CT fusion images after distribution of probes for 3 h (left panel) and 16 h (right panel). (E) 123I-FIAU SPECT/CT fusion images of the same mouse before (left panel) or after (right panel) 14 days of GCV therapy. (F) In vivo optical imaging of the nude mouse with wild-type and eGFP-tk. (D-F adapted with permission from , copyright 2008 Elsevier BV)
Figure 6
Figure 6
(A) Schematic of lentiviral vector with dual promoter, myc-hFTH, and GFP. (B) Analysis of in vitro MRI of agarose phantom suspended F-98 cells transfected with Lenti-myc-hFTH vector. (C) Prussian blue staining of iron deposits in mock and myc-hFTH tumors collected at 3 wk. (D) Immunofluorescence staining of myc-hFTH and GFP in mock and myc-hFTH tumors with anti-myc and anti-GFP antibodies. (E) In vivo FLI (left) and T2-weighted images (right) of MCF-7 tumors bearing myc-hFTH reporter gene after 21 days of subcutaneous transplantation. (A-E adapted with permission from , copyright 2010 American Association for Cancer Research)
Figure 7
Figure 7
(A) A “map” of the acquired FNuc spectra, displayed in a mouse bearing TKCDUPRT tumor xenograft as a matrix overlaid on the corresponding 1H-MR images. (B) MicroPET imaging of TK function at 16-18 h after i.v injection of 124I-FIAU. Coronal (left panel) and transverse (right panel) images are shown. The dashed line in the coronal image indicated the position of the transverse image. (C) Immunohistochemistry staining of Ki-67 and cleaved caspase-3 performed in TKCDUPRT-expressing and TKCD-expressing tumors. (D) Surviving fractions of TKCD and TKCDUPRT cells after a 24-h exposure to different concentrations of GCV, 5-FU or 5-FC. (E) Surviving fractions of TKCDUPRT (left panel) or TKCD (right panel) cells treated with different doses of GCV, 5-FC or GCV + 5-FC for 24 h. (F) Tumor growth kinetics in mice bearing TKCDUPRT tumors or TKCD tumors untreated or treated with different doses of GCV and 5-FC. (A-D adapted with permission from , copyright 2013 Nature Publishing Group)
Figure 8
Figure 8
Multimodality molecular imaging of Ad5-TGF-transfected bone marrow-derived stem cells after transplanted into the myocardial infarction rats model. (A) Images of microPET (upper row), fluorescence (middle row) and bioluminescence (lower row) in the heart region after transplantation at day 2, 3 and 7. Semi-quantitative analysis results obtained by regions of interest (ROIs) analysis of the heart region from 18F-FHBG microPET (B), fluorescence (C) and bioluminescence (D) imaging. (A-D adapted with permission from , copyright 2014 Public Library of Science)
Figure 9
Figure 9
(A) Schematic description of the TYR reporter gene system for multimodality molecular imaging. (B) Photographic images of tumor bearing mice (arrows point to the grafted tumor). (C) MRI images of MCF-7-TYR (left) and MCF-7 (right) tumors. Top row shows black and white images, and bottom row shows the pseudo-colored images. (D) PAI (top), ultrasound (middle), and PAI/US images (bottom) of the tumor mice. (E) Representative decay-corrected coronal (top) and transaxial (bottom) microPET images of MCF-7-TYR (left three images) and MCF-7 (right three images) tumors obtained at 0.5, 1 and 2 h after 18F-P3BZA injection. (A-E adapted with permission from , copyright 2013 Nature Publishing Group)
Figure 10
Figure 10
PET-CT imaging of viral-mediated HSV1-tk transgene expression in liver cancer patients. From left to right, the columns show 5 mm-thick coronal, sagittal, and transaxial sections from an 18F-FHBG PET-CT study. All sections are centered on the treated tumor lesion (yellow dotted lines in the CT images) and show 18F-FHBG accumulation at the tumor site (arrows, PET and fused images). The white foci in the liver seen on the CT images correspond to lipiodol retention (arrowheads) after transarterial embolization of the tumor and a transjugular intrahepatic portosystemic shunt (⋆). Tracer signal can be seen in the treated lesion (arrows, PET and fused images), whereas no specific accumulation of the tracer can be seen in the necrotic, lipiodol-retaining regions around it (fused image). H, heart; L, liver; LB, large bowel; RL, right lung; Sp, spleen. Adapted with permission from , copyright 2005 Springer Verlag)

Similar articles

Cited by

References

    1. Henriquez NV, van Overveld PG, Que I, Buijs JT, Bachelier R, Kaijzel EL. et al. Advances in optical imaging and novel model systems for cancer metastasis research. Clin Exp Metastasis. 2007;24:699–705. - PubMed
    1. Weissleder R, Mahmood U. Molecular imaging. Radiology. 2001;219:316–33. - PubMed
    1. Jaffer FA, Weissleder R. Molecular imaging in the clinical arena. Jama. 2005;293:855–62. - PubMed
    1. Massoud TF, Gambhir SS. Molecular imaging in living subjects: seeing fundamental biological processes in a new light. Genes Dev. 2003;17:545–80. - PubMed
    1. Thakur M, Lentle BC. Report of a summit on molecular imaging. Radiology. 2005;236:753–5. - PubMed

Publication types

LinkOut - more resources