

MMP1/PAR1/SP/NK1R paracrine loop modulates early perineural invasion of pancreatic cancer cells
- PMID: 29896303
- PMCID: PMC5996366
- DOI: 10.7150/thno.24281
MMP1/PAR1/SP/NK1R paracrine loop modulates early perineural invasion of pancreatic cancer cells
Abstract
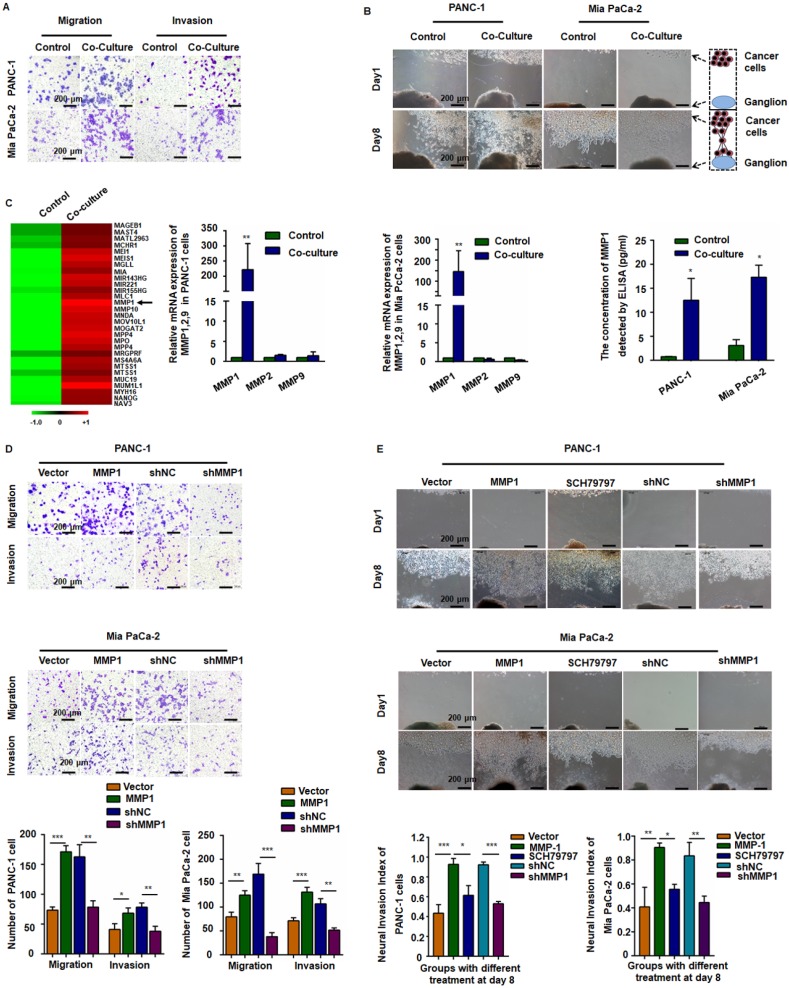
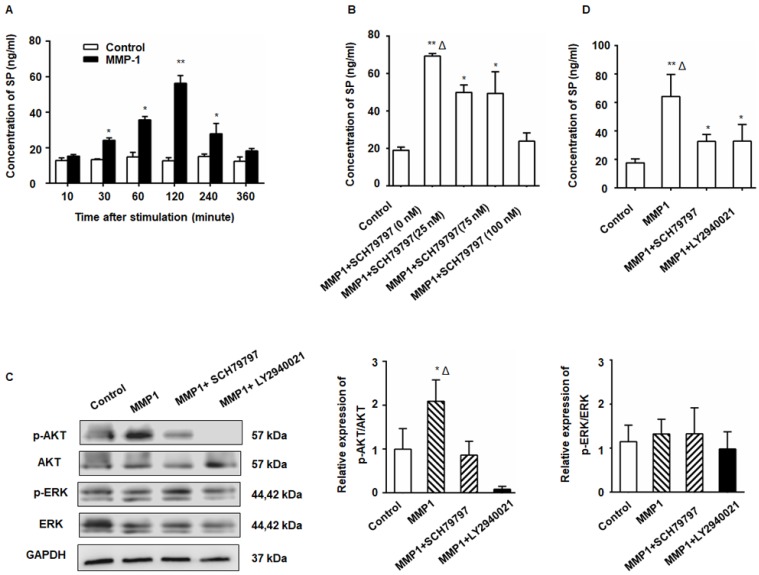
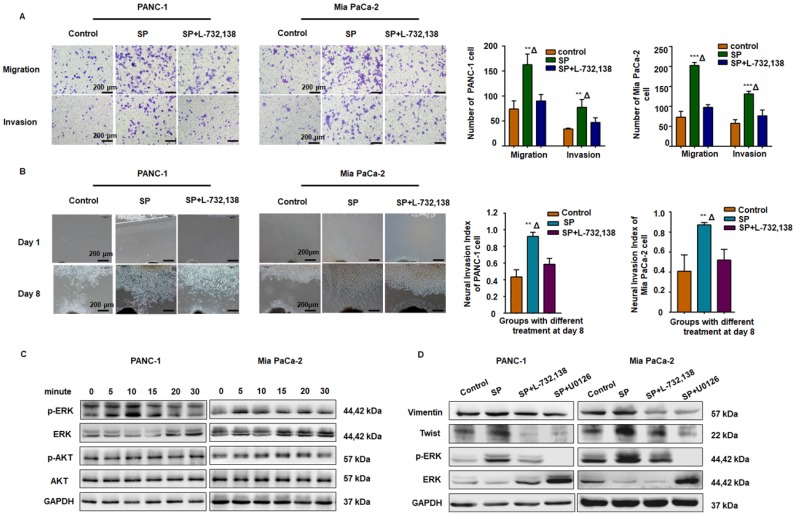
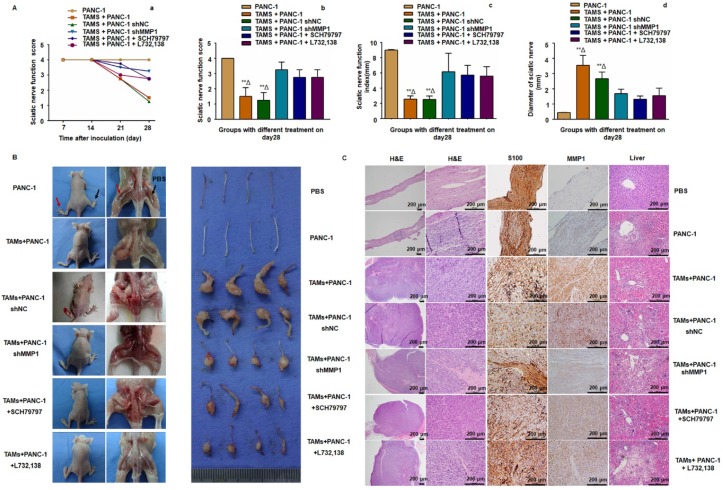
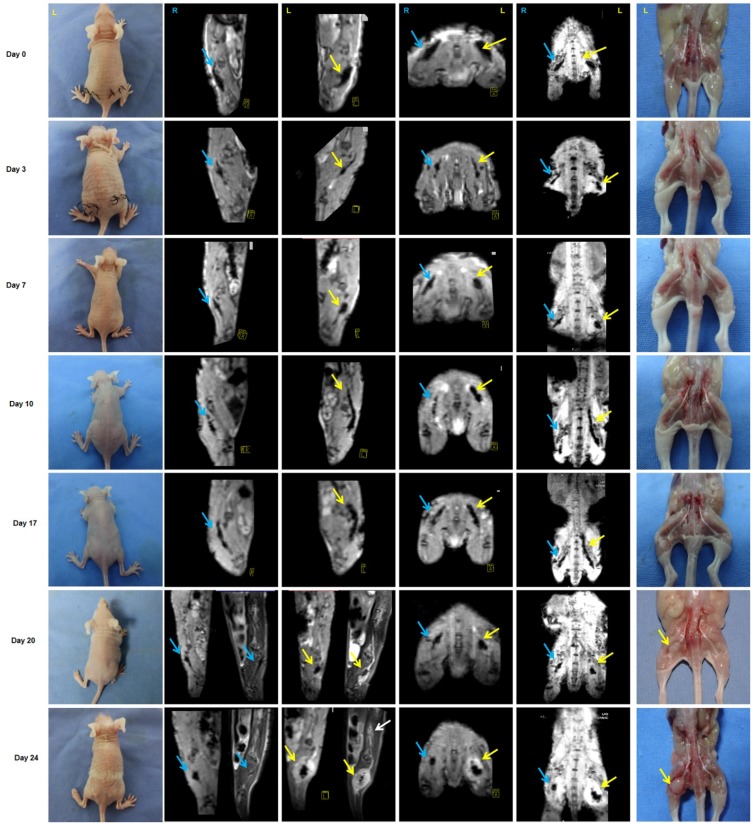
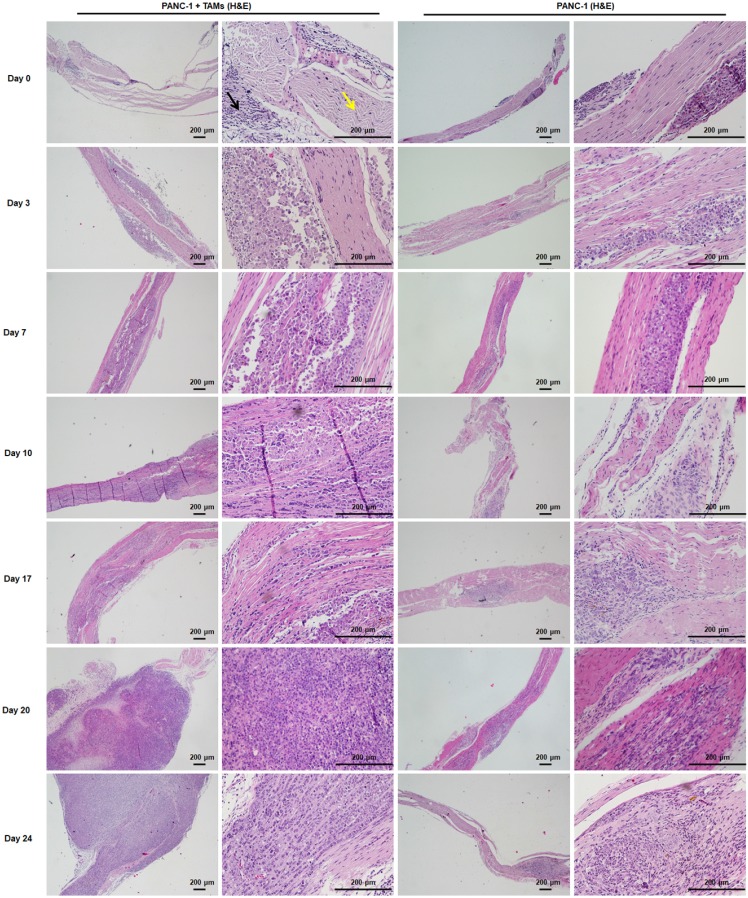
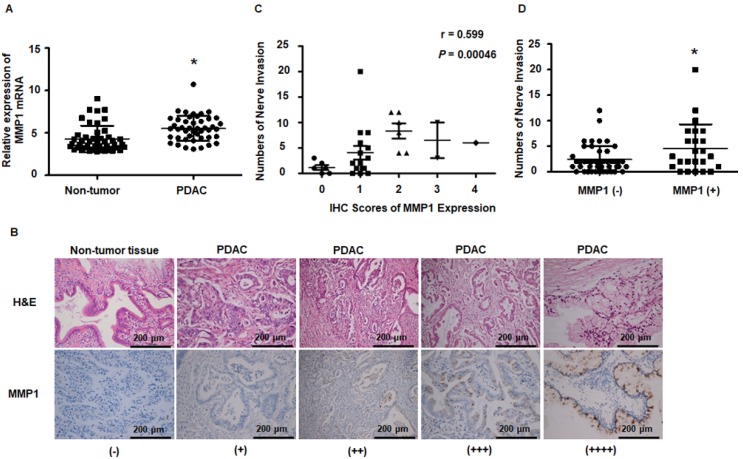
The molecular mechanism of perineural invasion (PNI) is unclear, and insufficient detection during early-stage PNI in vivo hampers its investigation. We aimed to identify a cytokine paracrine loop between pancreatic ductal adenocarcinoma (PDAC) cells and nerves and established a noninvasive method to monitor PNI in vivo. Methods: A Matrigel/ dorsal root ganglia (DRG) system was used to observe PNI in vitro, and a murine sciatic nerve invasion model was established to examine PNI in vivo. PNI was assessed by MRI with iron oxide nanoparticle labeling. We searched publicly available datasets as well as obtained PDAC tissues from 30 patients to examine MMP1 expression in human tumor and non-tumor tissues. Results: Our results showed that matrix metalloproteinase-1 (MMP1) activated AKT and induced protease-activated receptor-1 (PAR1)-expressing DRG to release substance P (SP), which, in turn, activated neurokinin 1 receptor (NK1R)-expressing PDAC cells and enhanced cellular migration, invasion, and PNI via SP/NK1R/ERK. In animals, hind limb paralysis and a decreased hind paw width were observed approximately 20 days after inoculation of cancer cells in the perineurium. MMP1 silencing with shRNA or treatment with either a PAR1 or an NK1R antagonist inhibited PNI. MRI detected PNI as early as 10 days after implantation of PDAC cells. PNI also induced PDAC liver metastasis. Bioinformatic analyses and pathological studies on patient tissues corroborated the clinical relevance of these findings. Conclusion: In this study, we provided evidence that the MMP1/PAR1/SP/NK1R paracrine loop contributes to PNI during the early stage of primary tumor formation. Furthermore, we established a sensitive and non-invasive method to detect nerve invasion using iron oxide nanoparticles and MRI.
Keywords: MR imaging; iron oxide nanoparticles; metastasis; pancreatic ductal adenocarcinoma; perineural invasion.
Conflict of interest statement
Competing Interests: The authors have declared that no competing interest exists.
Figures
Similar articles
-
Neurotransmitter substance P mediates pancreatic cancer perineural invasion via NK-1R in cancer cells.Mol Cancer Res. 2013 Mar;11(3):294-302. doi: 10.1158/1541-7786.MCR-12-0609. Epub 2013 Jan 23. Mol Cancer Res. 2013. PMID: 23345604 Free PMC article.
-
GFRα1 released by nerves enhances cancer cell perineural invasion through GDNF-RET signaling.Proc Natl Acad Sci U S A. 2014 May 13;111(19):E2008-17. doi: 10.1073/pnas.1402944111. Epub 2014 Apr 28. Proc Natl Acad Sci U S A. 2014. PMID: 24778213 Free PMC article.
-
Glutamate from nerve cells promotes perineural invasion in pancreatic cancer by regulating tumor glycolysis through HK2 mRNA-m6A modification.Pharmacol Res. 2023 Jan;187:106555. doi: 10.1016/j.phrs.2022.106555. Epub 2022 Nov 17. Pharmacol Res. 2023. PMID: 36403721
-
Coagulation Signaling through PAR1 as a Therapeutic Target in Pancreatic Ductal Adenocarcinoma.Int J Mol Sci. 2021 May 12;22(10):5138. doi: 10.3390/ijms22105138. Int J Mol Sci. 2021. PMID: 34066284 Free PMC article. Review.
-
Cellular and molecular mechanisms of perineural invasion of pancreatic ductal adenocarcinoma.Cancer Commun (Lond). 2021 Aug;41(8):642-660. doi: 10.1002/cac2.12188. Epub 2021 Jul 15. Cancer Commun (Lond). 2021. PMID: 34264020 Free PMC article. Review.
Cited by
-
Nodal Enhances Perineural Invasion in Pancreatic Cancer by Promoting Tumor-Nerve Convergence.J Healthc Eng. 2022 Jan 27;2022:9658890. doi: 10.1155/2022/9658890. eCollection 2022. J Healthc Eng. 2022. PMID: 35126957 Free PMC article.
-
Neurokinin-1 receptor promotes non-small cell lung cancer progression through transactivation of EGFR.Cell Death Dis. 2022 Jan 10;13(1):41. doi: 10.1038/s41419-021-04485-y. Cell Death Dis. 2022. PMID: 35013118 Free PMC article.
-
Perineural invasion of cancer: a complex crosstalk between cells and molecules in the perineural niche.Am J Cancer Res. 2019 Jan 1;9(1):1-21. eCollection 2019. Am J Cancer Res. 2019. PMID: 30755808 Free PMC article. Review.
-
Investigation of the correlation between AGRN expression and perineural invasion in colon cancer.Front Mol Biosci. 2024 Dec 3;11:1510478. doi: 10.3389/fmolb.2024.1510478. eCollection 2024. Front Mol Biosci. 2024. PMID: 39691475 Free PMC article.
-
The Repurposing of Non-Peptide Neurokinin-1 Receptor Antagonists as Antitumor Drugs: An Urgent Challenge for Aprepitant.Int J Mol Sci. 2023 Nov 3;24(21):15936. doi: 10.3390/ijms242115936. Int J Mol Sci. 2023. PMID: 37958914 Free PMC article. Review.
References
-
- Liebig C, Ayala G, Wilks JA, Berger DH, Albo D. Perineural invasion in cancer: a review of the literature. Cancer. 2009;115:3379–91. - PubMed
-
- Gil Z, Carlson DL, Gupta A. et al. Patterns and incidence of neural invasion in patients with cancers of the paranasal sinuses. Arch Otolaryngol Head Neck Surg. 2009;135:173–9. - PubMed
-
- Abiatari I, DeOliveira T, Kerkadze V. et al. Consensus transcriptome signature of perineural invasion in pancreatic carcinoma. Mol Cancer Ther. 2009;8:1494–504. - PubMed
-
- Koide N, Yamada T, Shibata R. et al. Establishment of perineural invasion models and analysis of gene expression revealed an invariant chain (CD74) as a possible molecule involved in perineural invasion in pancreatic cancer. Clin Cancer Res. 2006;12:2419–26. - PubMed
-
- Ayala GE, Wheeler TM, Shine HD. et al. In vitro dorsal root ganglia and human prostate cell line interaction: redefining perineural invasion in prostate cancer. Prostate. 2001;49:213–23. - PubMed
Publication types
MeSH terms
Substances
LinkOut - more resources
Full Text Sources
Other Literature Sources
Medical
Miscellaneous
