

Premenopausal breast cancer: potential clinical utility of a multi-omics based machine learning approach for patient stratification
- PMID: 29896316
- PMCID: PMC5972143
- DOI: 10.1007/s13167-018-0131-0
Premenopausal breast cancer: potential clinical utility of a multi-omics based machine learning approach for patient stratification
Abstract
Background: The breast cancer (BC) epidemic is a multifactorial disease attributed to the early twenty-first century: about two million of new cases and half a million deaths are registered annually worldwide. New trends are emerging now: on the one hand, with respect to the geographical BC prevalence and, on the other hand, with respect to the age distribution. Recent statistics demonstrate that young populations are getting more and more affected by BC in both Eastern and Western countries. Therefore, the old rule "the older the age, the higher the BC risk" is getting relativised now. Accumulated evidence shows that young premenopausal women deal with particularly unpredictable subtypes of BC such as triple-negative BC, have lower survival rates and respond less to conventional chemotherapy compared to the majority of postmenopausal BC.
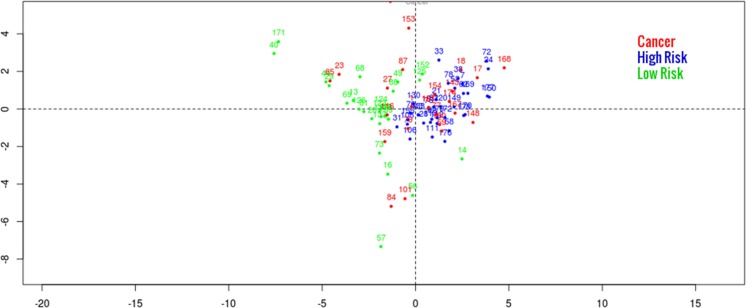
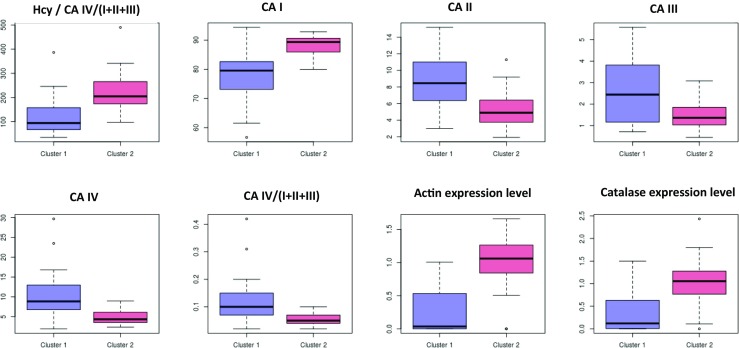
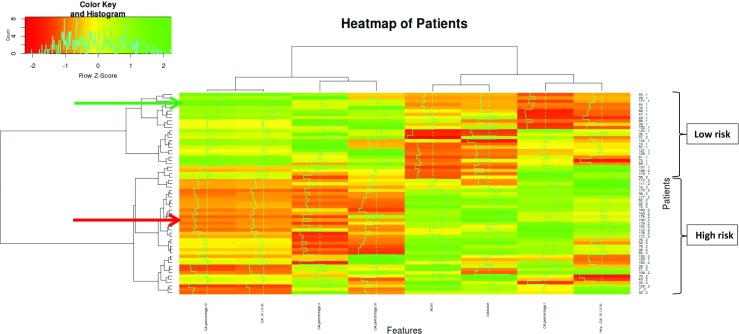
Working hypothesis: Here we hypothesised that a multi-level diagnostic approach may lead to the identification of a molecular signature highly specific for the premenopausal BC. A multi-omic approach using machine learning was considered as a potent tool for stratifying patients with benign breast alterations into well-defined risk groups, namely individuals at high versus low risk for breast cancer development.
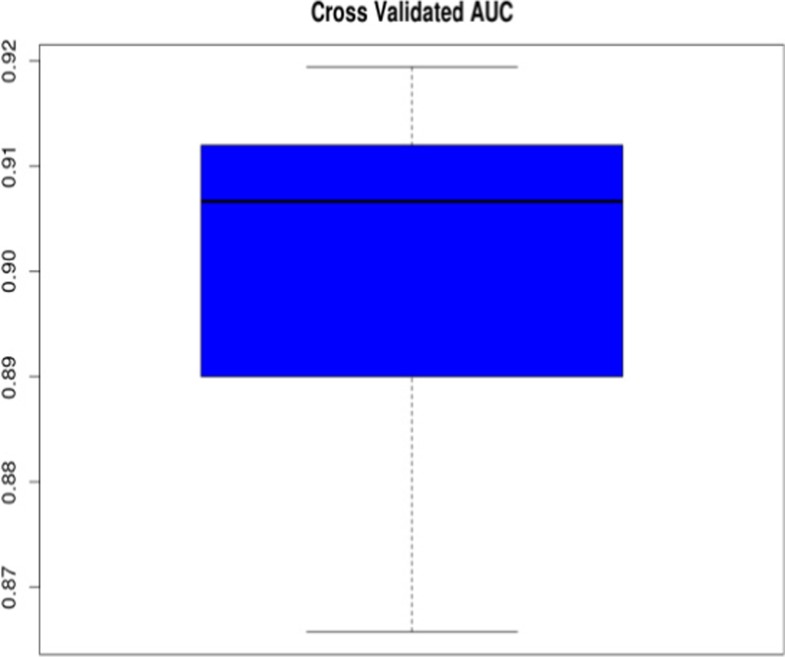
Results and conclusions: The study resulted in identifying multi-omic signature specific for the premenopausal BC that can be used for stratifying patients with benign breast alterations. Our predictive model is capable of discriminating individually between high and low BC-risk with high confidence (>90%) and considered of potential clinical utility. Novel risk assessment approaches and advanced screening programmes-as the long-term target of this project-are of particular importance for predictive, preventive and personalised medicine as the medicine of the future, due to the expected health benefits for young subpopulations and the healthcare system as a whole.
Keywords: Bioinformatics; Biomarker panel; Breast cancer; Laboratory medicine; Machine learning; Menopause; Multi-level diagnostics; Patient stratification; Predictive preventive personalised medicine.
Conflict of interest statement
Compliance with ethical standardsThe authors declare that they have no competing interests.Not applicable.All the patient investigations conformed to the principles outlined in the Declaration of Helsinki and have been performed with the permission (Nr. 148/05) released by the responsible Ethic’s Committee of the Medical Faculty, Rheinische Friedrich-Wilhelms-University of Bonn. Human rights have been obligatory protected during the entire duration of the project according to the European standards. All the patients were informed about the purposes of the study and have signed their “consent of the patient”. This article does not contain any studies with animals performed by any of the authors.
Figures
Similar articles
-
Breast Cancer in Young Women: Status Quo and Advanced Disease Management by a Predictive, Preventive, and Personalized Approach.Cancers (Basel). 2019 Nov 14;11(11):1791. doi: 10.3390/cancers11111791. Cancers (Basel). 2019. PMID: 31739537 Free PMC article. Review.
-
Multi-omic approach decodes paradoxes of the triple-negative breast cancer: lessons for predictive, preventive and personalised medicine.Amino Acids. 2018 Apr;50(3-4):383-395. doi: 10.1007/s00726-017-2524-0. Epub 2017 Dec 16. Amino Acids. 2018. PMID: 29249020
-
Postmenopausal breast cancer: European challenge and innovative concepts.EPMA J. 2017 May 30;8(2):159-169. doi: 10.1007/s13167-017-0094-6. eCollection 2017 Jun. EPMA J. 2017. PMID: 28824739 Free PMC article.
-
The association between body mass index and immunohistochemical subtypes in breast cancer.Breast. 2017 Apr;32:227-236. doi: 10.1016/j.breast.2016.09.019. Epub 2016 Oct 15. Breast. 2017. PMID: 27756509
-
Blood-Based mRNA Tests as Emerging Diagnostic Tools for Personalised Medicine in Breast Cancer.Cancers (Basel). 2023 Feb 8;15(4):1087. doi: 10.3390/cancers15041087. Cancers (Basel). 2023. PMID: 36831426 Free PMC article. Review.
Cited by
-
Breast Cancer in Young Women: Status Quo and Advanced Disease Management by a Predictive, Preventive, and Personalized Approach.Cancers (Basel). 2019 Nov 14;11(11):1791. doi: 10.3390/cancers11111791. Cancers (Basel). 2019. PMID: 31739537 Free PMC article. Review.
-
Comparing Quality of Life in Breast Cancer Patients Who Underwent Mastectomy Versus Breast-Conserving Surgery: A Meta-Analysis.Int J Environ Res Public Health. 2019 Dec 6;16(24):4970. doi: 10.3390/ijerph16244970. Int J Environ Res Public Health. 2019. PMID: 31817811 Free PMC article.
-
Multi-omics assessment of dilated cardiomyopathy using non-negative matrix factorization.PLoS One. 2022 Aug 18;17(8):e0272093. doi: 10.1371/journal.pone.0272093. eCollection 2022. PLoS One. 2022. PMID: 35980883 Free PMC article.
-
Implementation of artificial intelligence and non-contact infrared thermography for prediction and personalized automatic identification of different stages of cellulite.EPMA J. 2020 Feb 7;11(1):17-29. doi: 10.1007/s13167-020-00199-x. eCollection 2020 Mar. EPMA J. 2020. PMID: 32140183 Free PMC article.
-
Carotenoids in Cancer Apoptosis-The Road from Bench to Bedside and Back.Cancers (Basel). 2020 Aug 26;12(9):2425. doi: 10.3390/cancers12092425. Cancers (Basel). 2020. PMID: 32859058 Free PMC article. Review.
References
-
- Golubnitschaja O, Debald M, Yeghiazaryan K, Kuhn W, Pešta M, Costigliola V, Grech G. Breast cancer epidemic in the early 21st century: evaluation of risk factors, cumulative questionnaires and recommendations for preventive measures. Tumor Biol. 2016;37(10):12941–12957. doi: 10.1007/s13277-016-5168-x. - DOI - PubMed
-
- American Cancer Society . Global cancer facts & figures. 2. Atlanta: American Cancer Society; 2011.
LinkOut - more resources
Full Text Sources
Other Literature Sources
