Review
. 2018 Apr 24;9(19):4370-4380.
doi: 10.1039/c8sc01153b. eCollection 2018 May 21.

Recent advances in near-infrared II fluorophores for multifunctional biomedical imaging

Affiliations
Review

Recent advances in near-infrared II fluorophores for multifunctional biomedical imaging

Feng Ding et al. Chem Sci. .

Abstract

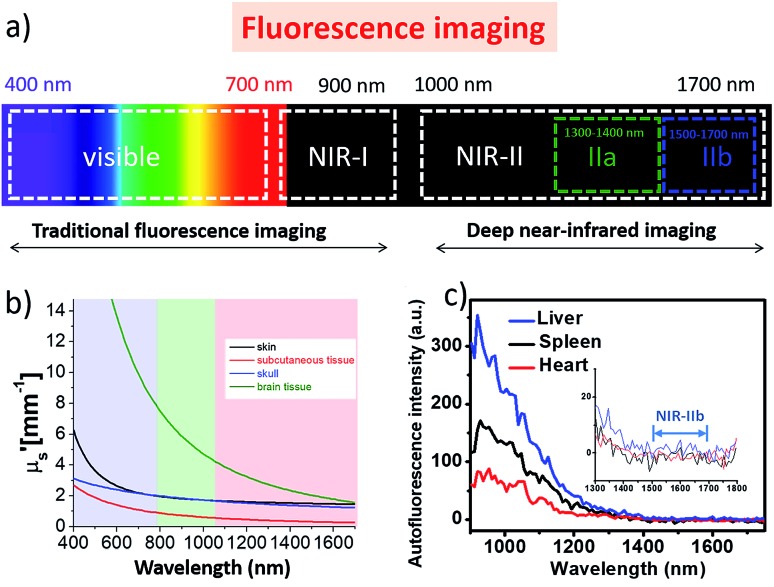
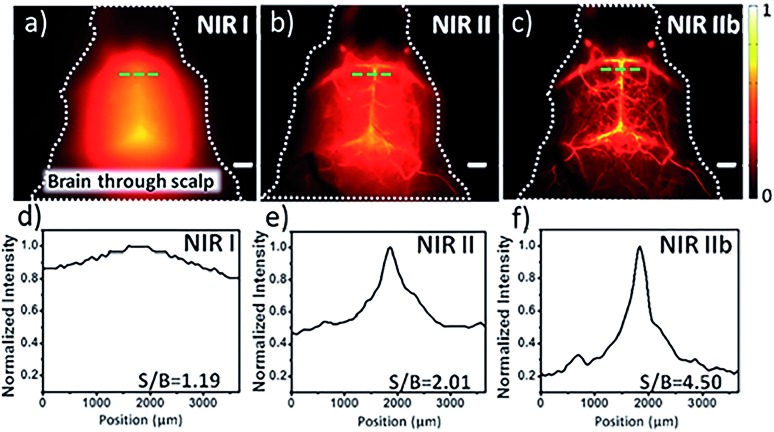
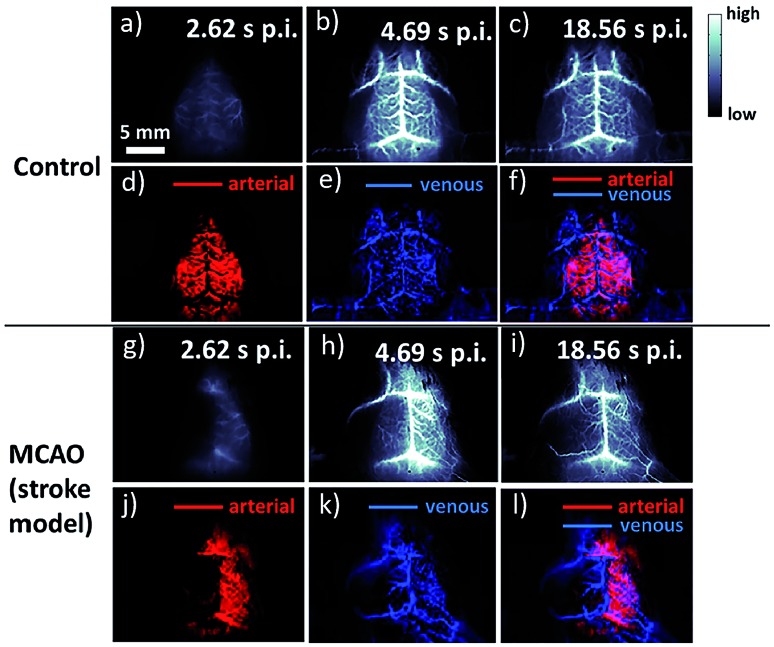
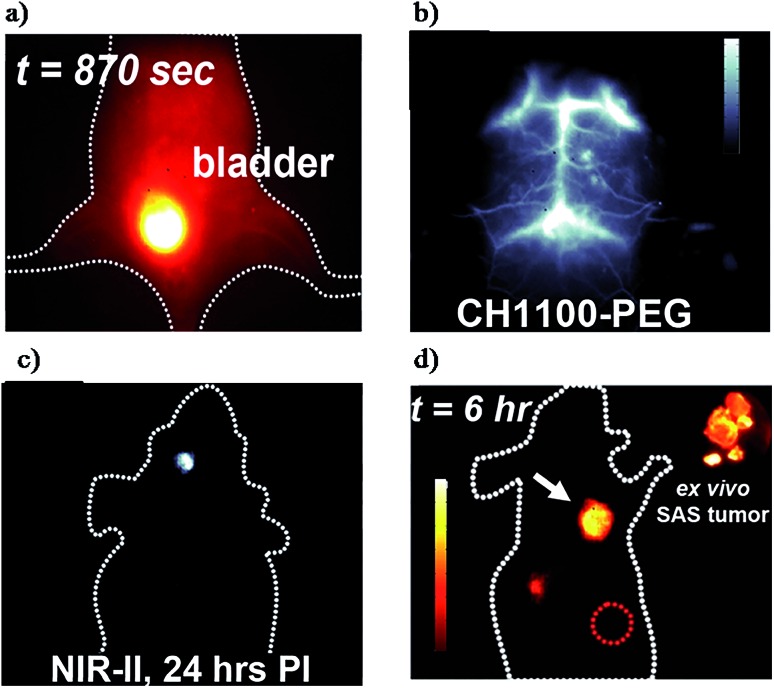
In recent years, owing to unsatisfactory clinical imaging clarity and depths in the living body for early diagnosis and prognosis, novel imaging modalities with high bioimaging performance have been actively explored. The remarkable headway made in the second near-infrared region (NIR-II, 1000-1700 nm) has promoted the development of biomedical imaging significantly. NIR-II fluorescence imaging possesses a number of merits which prevail over the traditional and NIR-I (400-900 nm) imaging modalities in fundamental research, such as reduced photon scattering, as well as auto-fluorescence and improved penetration depth. Functional probes for instant and precise feedback of in vivo information are at the core of this modality for superb imaging. Herein, we review the recently developed fluorophores including carbon nanotubes, organic small molecules, quantum dots, conjugated polymers and rare-earth-doped materials to present superior and multifunctionality of biomedical imaging in the NIR-II regions (1000-1700 nm).


Figures

Fig. 1
Fig. 1. (a) Wavelengths for fluorescence imaging; (b) the reduced scattering coefficient, μs, is plotted as a function of wavelength in the range of 400–1700 nm for various tissue types including the skin (black), the brain tissue (green), the skull (blue) and the subcutaneous tissue (red). (c) Auto-fluorescence spectrum of ex vivo mouse liver, spleen and heart tissue.
Fig. 2
Fig. 2. Fluorescence imaging of the cerebrovasculature of mice without craniotomy in the (a) NIR-I; (b) NIR-II and (c) NIR-IIb regions, with the corresponding SBR analysis shown in (d)–(f). Scale bars: 2 mm. Reproduced from ref. 62 with permission from John Wiley and Sons.
Fig. 3
Fig. 3. Fluorescence imaging of the cerebrovasculature of mice without craniotomy. (a)–(c) Time-course NIR-IIa images of a control healthy mouse (mouse C1); (d)–(f) PCA overlaid images showing arterial (red) and venous (blue) vessels of mouse C1. (g)–(i) Time-course NIR-IIa images of a mouse with MCAO (mouse M1); (j)–(l) PCA overlaid images showing arterial (red) and venous (blue) vessels of mouse M1. Scale bars: 2 mm. Reproduced from ref. 63 with permission from Springer Nature.
Fig. 4
Fig. 4. (a) Renal excretion of CH1055-PEG. (b) Brain vessel imaging. (c) Glioblastoma brain tumor detection. (d) Molecular imaging of skin cancer tumors via the CH1055-affibody. Reproduced from ref. 36 with permission from Springer Nature.
Fig. 5
Fig. 5. The library of small organic NIR-II fluorophores.
Fig. 6
Fig. 6. (a) Blood vascular imaging of a nude mouse with PEGylated Ag2S QDs. (b) Imaging of U87MG tumor blood vascular with PEGylated Ag2S QDs. (c) NIR-II images of the vasculature of brain. Reproduced from Ref. 102 with permission from Elsevier Ltd.
Fig. 7
Fig. 7. (a) The structure of the pDA polymer. (b) The schematic of the pDA-PEG nanoparticle based NIR-II probe. (c) AFM image of the pDA-PEG probe. (d) Absorption and emission spectra of pDA-PEG; (e) white-light and NIR-II images of EGFR-positive MDA-MB-468 cells and EGFR-negative U87MG cells incubated with the pDA-PEG-Erbitux conjugate. (f) Average NIR-II fluorescence of EGFR-positive MDA-MB-468 cells and EGFR-negative U87MG cells, showing a positive/negative ratio of 5.8. (g) A time course of NIR-II fluorescence images of a mouse hindlimb immediately following intravenous injection of pDA-PEG. (h) A plot of the distance travelled by the blood flow front as a function of time. The linear fit reveals an average blood velocity of 4.36 cm s–1 in the femoral artery. (i) A plot of instantaneous velocity (derived by dividing flow front travelled distance between two consecutive frames by the time interval of 39 ms) as a function of time, revealing periodic changes of instantaneous velocity corresponding to cardiac cycles. (j) An NIR-II fluorescence image of the same mouse hindlimb after full perfusion of pDA-PEG-containing blood into the hindlimb, upon which the fluorescence intensity in the hindlimb became unchanging. The scale bars in (g) and (j) indicate 5 mm. Reproduced from ref. 39 with permission from Springer Nature.
Fig. 8
Fig. 8. (a) Schematic design of a Ce3+ doped Er-RENPs. (b) TEM and HRTEM images. (c) The luminescence spectrum of the Er-RENPs with or without 2% Ce3+ doping. (d) Schematic illustration outlining the surface modification of the Er-RENPs. (e) The luminescence spectrum of oleic acid-capped Er-RENPs dispersed in cyclohexane and Er-RENPs@PMH-PEG dispersed in water. (f) The photostability of Er-RENPs@PMH-PEG in PBS and FBS solutions. (g) Color photograph of a C57BI/6 mouse. (h) and (i) time-course NIR-IIb brain fluorescence images showing the perfusion of RENPs into various cerebral vessels. (j) Cerebral vascular image in the NIR-IIb region with corresponding PCA overlaid image. (k) SBR analysis of the NIR-IIb cerebrovascular image. Reproduced from ref. 132 with permission from Springer Nature.

References

    1. Weissleder R. Science. 2006;312:1168–1171. - PubMed
    1. Hoffman J. M., Gambhir S. S. Radiology. 2007;244:39–47. - PubMed
    1. Chen H., Dong B. L., Tang Y. H., Lin W. Y. Acc. Chem. Res. 2017;50:1410–1422. - PubMed
    1. Hong G. S., Antaris A. L., Dai H. J. Nat. Biomed. Eng. 2017;1:0010.
    1. Hou J. T., Ren W. X., Li K., Seo J., Shama A., Yu X. Q., Kim J. S. Chem. Soc. Rev. 2017;53:2076–2090. - PubMed