

High Intensity High Volume Interval Training Improves Endurance Performance and Induces a Nearly Complete Slow-to-Fast Fiber Transformation on the mRNA Level
- PMID: 29897050
- PMCID: PMC5987183
- DOI: 10.3389/fphys.2018.00601
High Intensity High Volume Interval Training Improves Endurance Performance and Induces a Nearly Complete Slow-to-Fast Fiber Transformation on the mRNA Level
Abstract
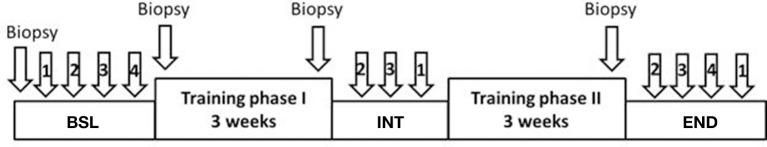
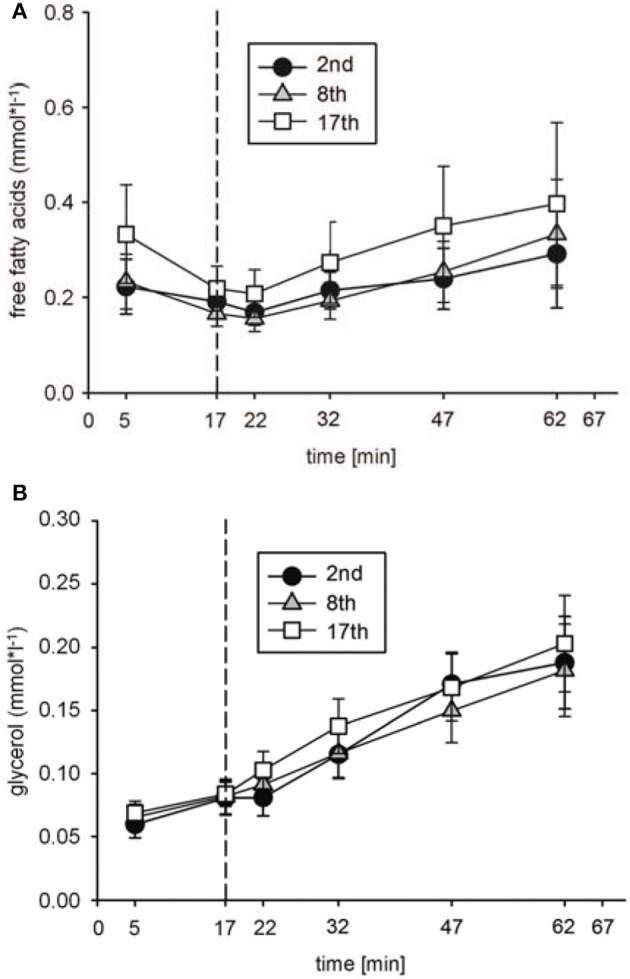
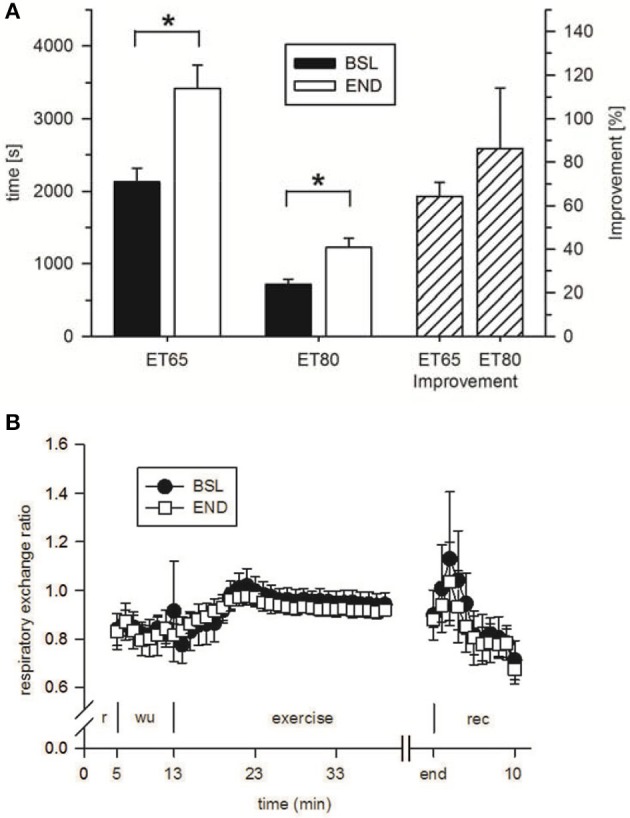
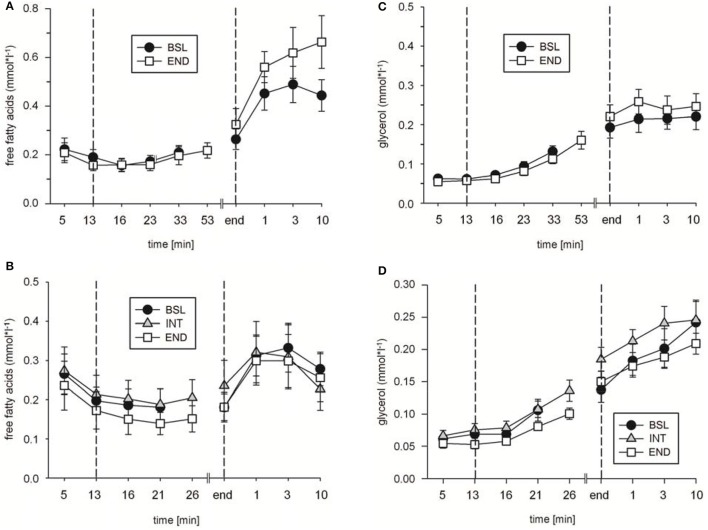
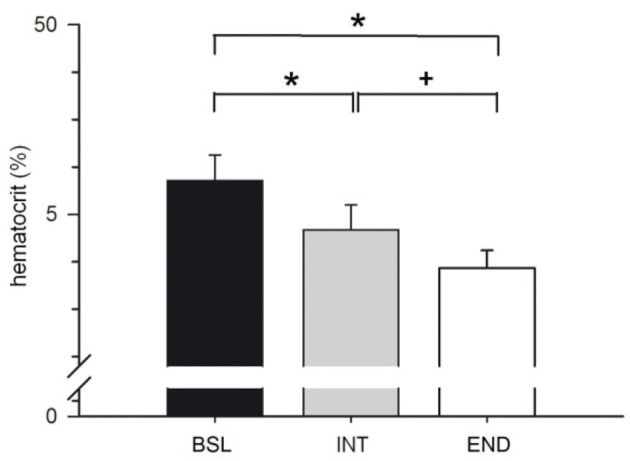
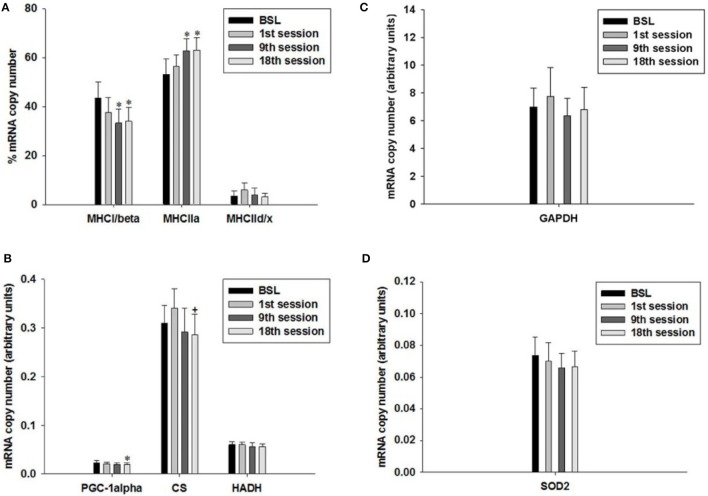
We present here a longitudinal study determining the effects of two 3 week-periods of high intensity high volume interval training (HIHVT) (90 intervals of 6 s cycling at 250% maximum power, Pmax/24 s) on a cycle ergometer. HIHVT was evaluated by comparing performance tests before and after the entire training (baseline, BSL, and endpoint, END) and between the two training sets (intermediate, INT). The mRNA expression levels of myosin heavy chain (MHC) isoforms and markers of energy metabolism were analyzed in M. vastus lateralis biopsies by quantitative real-time PCR. In incremental tests peak power (Ppeak) was increased, whereas O2peak was unaltered. Prolonged time-to-exhaustion was found in endurance tests with 65 and 80% Pmax at INT and END. No changes in blood levels of lipid metabolites were detected. Training-induced decreases of hematocrit indicate hypervolemia. A shift from slow MHCI/β to fast MHCIIa mRNA expression occurred after the first and second training set. The mRNA expression of peroxisome proliferator-activated receptor gamma coactivator 1α (PGC-1α), a master regulator of oxidative energy metabolism, decreased after the second training set. In agreement, a significant decrease was also found for citrate synthase mRNA after the second training set, indicating reduced oxidative capacity. However, mRNA expression levels of glycolytic marker enzyme glyceraldehyde-3-phosphate dehydrogenase did not change after the first and second training set. HIHVT induced a nearly complete slow-to-fast fiber type transformation on the mRNA level, which, however, cannot account for the improvements of performance parameters. The latter might be explained by the well-known effects of hypervolemia on exercise performance.
Keywords: energy metabolism; interval training; muscular aerobic capacity; myosin heavy chain; performance parameter; systemic aerobic capacity.
Figures
Similar articles
-
High-intensity high-volume swimming induces more robust signaling through PGC-1α and AMPK activation than sprint interval swimming in m. triceps brachii.PLoS One. 2017 Oct 3;12(10):e0185494. doi: 10.1371/journal.pone.0185494. eCollection 2017. PLoS One. 2017. PMID: 28973039 Free PMC article.
-
PGC-1alpha and PGC-1beta have both similar and distinct effects on myofiber switching toward an oxidative phenotype.Am J Physiol Endocrinol Metab. 2006 Oct;291(4):E807-16. doi: 10.1152/ajpendo.00591.2005. Epub 2006 May 23. Am J Physiol Endocrinol Metab. 2006. PMID: 16720625
-
Calcineurin regulates slow myosin, but not fast myosin or metabolic enzymes, during fast-to-slow transformation in rabbit skeletal muscle cell culture.J Physiol. 2001 May 15;533(Pt 1):215-26. doi: 10.1111/j.1469-7793.2001.0215b.x. J Physiol. 2001. PMID: 11351029 Free PMC article.
-
Muscle mechanics: adaptations with exercise-training.Exerc Sport Sci Rev. 1996;24:427-73. Exerc Sport Sci Rev. 1996. PMID: 8744258 Review.
-
The science of cycling: physiology and training - part 1.Sports Med. 2005;35(4):285-312. doi: 10.2165/00007256-200535040-00002. Sports Med. 2005. PMID: 15831059 Review.
Cited by
-
Effect of carbohydrate-protein supplementation on endurance training adaptations.Eur J Appl Physiol. 2020 Oct;120(10):2273-2287. doi: 10.1007/s00421-020-04450-1. Epub 2020 Aug 5. Eur J Appl Physiol. 2020. PMID: 32757065 Free PMC article. Clinical Trial.
-
Efficacy of high-intensity interval- or continuous aerobic-training on insulin resistance and muscle function in adults with metabolic syndrome: a clinical trial.Eur J Appl Physiol. 2022 Feb;122(2):331-344. doi: 10.1007/s00421-021-04835-w. Epub 2021 Oct 23. Eur J Appl Physiol. 2022. PMID: 34687360 Clinical Trial.
-
Individual physiological and mitochondrial responses during 12 weeks of intensified exercise.Physiol Rep. 2021 Aug;9(15):e14962. doi: 10.14814/phy2.14962. Physiol Rep. 2021. PMID: 34327858 Free PMC article.
-
A Multi-Center Comparison of O2peak Trainability Between Interval Training and Moderate Intensity Continuous Training.Front Physiol. 2019 Feb 5;10:19. doi: 10.3389/fphys.2019.00019. eCollection 2019. Front Physiol. 2019. PMID: 30804794 Free PMC article.
-
Changes in biomarker levels and myofiber constitution in rat soleus muscle at different exercise intensities.Mol Cell Biochem. 2019 Aug;458(1-2):79-87. doi: 10.1007/s11010-019-03532-9. Epub 2019 Apr 16. Mol Cell Biochem. 2019. PMID: 30993497
References
LinkOut - more resources
Full Text Sources
Other Literature Sources
Research Materials