

Ethylene modulates root cortical senescence in barley
- PMID: 29897390
- PMCID: PMC6025243
- DOI: 10.1093/aob/mcy059
Ethylene modulates root cortical senescence in barley
Abstract
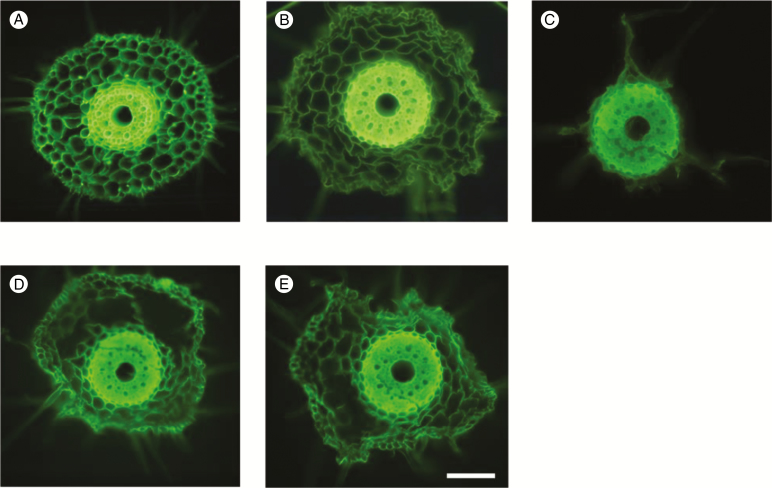
Background and aims: Root cortical senescence (RCS) is a poorly understood phenomenon with implications for adaptation to edaphic stress. It was hypothesized that RCS in barley (Hordeum vulgare L.) is (1) accelerated by exogenous ethylene exposure; (2) accompanied by differential expression of ethylene synthesis and signalling genes; and (3) associated with differential expression of programmed cell death (PCD) genes.
Methods: Gene expression of root segments from four barley genotypes with and without RCS was evaluated using quantitative real-time PCR (qRT-PCR). The progression of RCS was manipulated with root zone ethylene and ethylene inhibitor applications.
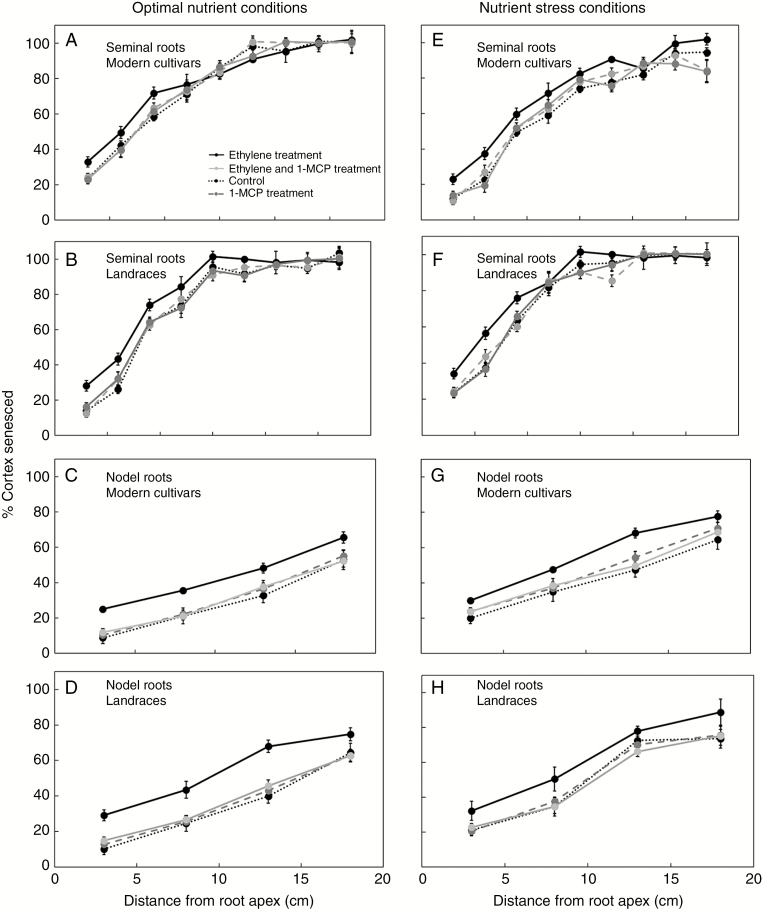
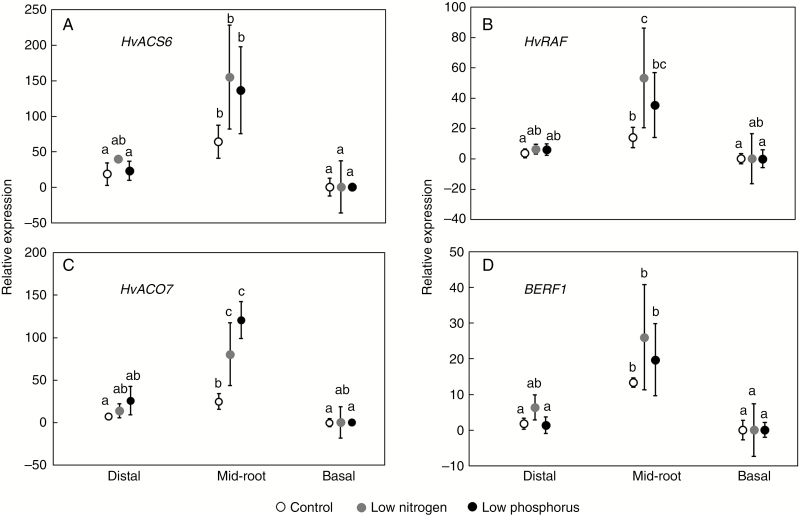
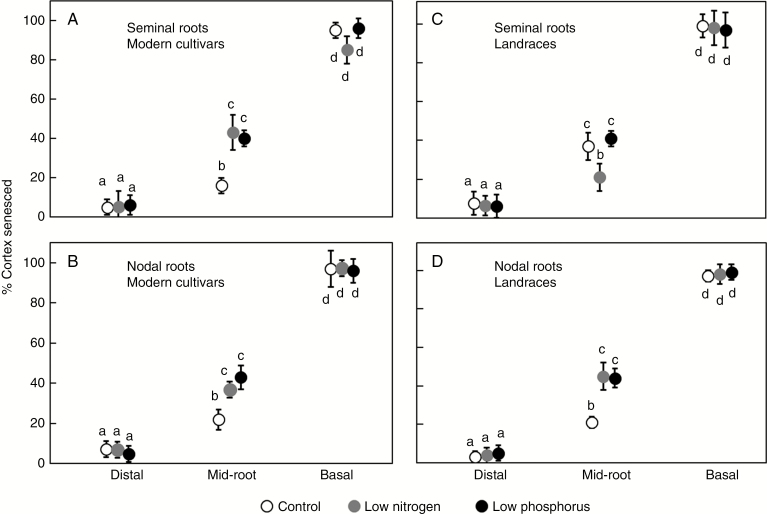
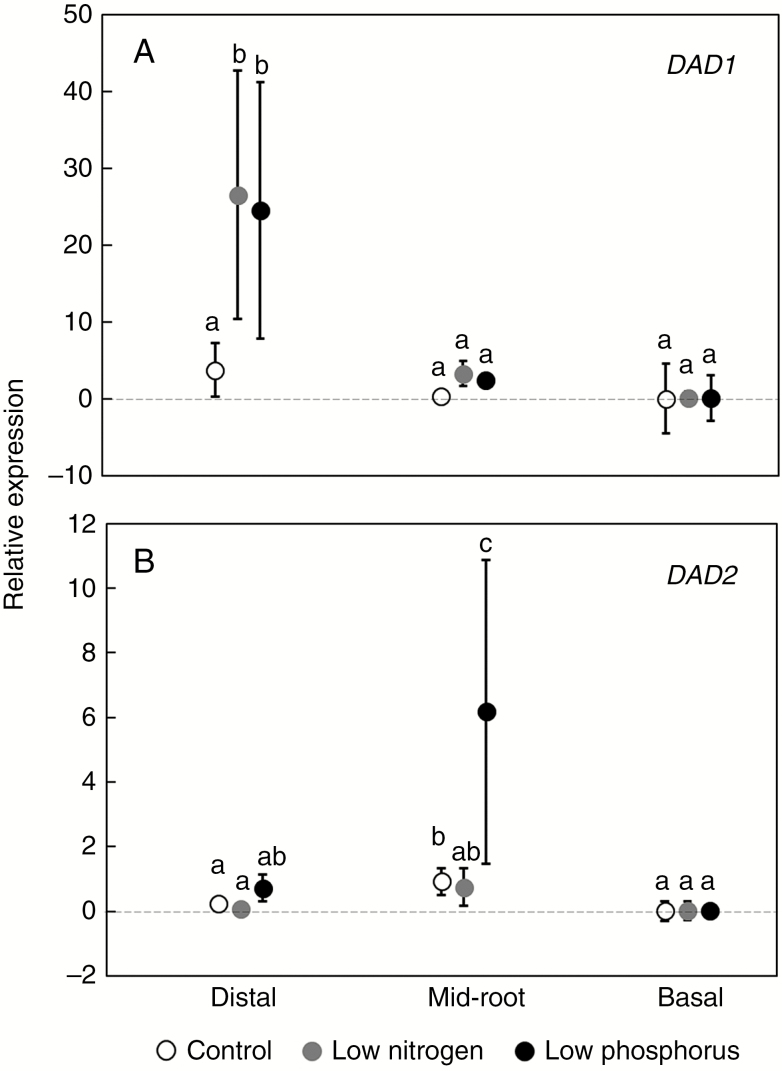
Key results: The results demonstrate that ethylene modulates RCS. Four genes related to ethylene synthesis and signalling were upregulated during RCS in optimal, low nitrogen and low phosphorus nutrient regimes. RCS was accelerated by root zone ethylene treatment, and this effect was reversed by an ethylene action inhibitor. Roots treated with exogenous ethylene had 35 and 46 % more cortical senescence compared with the control aeration treatment in seminal and nodal roots, respectively. RCS was correlated with expression of two genes related to programmed cell death (PCD).
Conclusions: The development of RCS is similar to root cortical aerenchyma formation with respect to ethylene modulation of the PCD process.
Figures
Similar articles
-
Transcript profiles in cortical cells of maize primary root during ethylene-induced lysigenous aerenchyma formation under aerobic conditions.Ann Bot. 2015 May;115(6):879-94. doi: 10.1093/aob/mcv018. Epub 2015 Apr 8. Ann Bot. 2015. PMID: 25858325 Free PMC article.
-
Root Cortical Senescence Improves Growth under Suboptimal Availability of N, P, and K.Plant Physiol. 2017 Aug;174(4):2333-2347. doi: 10.1104/pp.17.00648. Epub 2017 Jun 30. Plant Physiol. 2017. PMID: 28667049 Free PMC article.
-
Root cortical senescence decreases root respiration, nutrient content and radial water and nutrient transport in barley.Plant Cell Environ. 2017 Aug;40(8):1392-1408. doi: 10.1111/pce.12933. Epub 2017 Apr 12. Plant Cell Environ. 2017. PMID: 28164319
-
Programmed cell death and aerenchyma formation in roots.Trends Plant Sci. 2000 Mar;5(3):123-7. doi: 10.1016/s1360-1385(00)01570-3. Trends Plant Sci. 2000. PMID: 10707078 Review.
-
Hidden aging: the secret role of root senescence.Trends Plant Sci. 2025 May;30(5):553-564. doi: 10.1016/j.tplants.2025.02.004. Epub 2025 Mar 11. Trends Plant Sci. 2025. PMID: 40074576 Review.
Cited by
-
The hidden half comes into the spotlight: Peeking inside the black box of root developmental phases.Plant Commun. 2021 Sep 23;3(1):100246. doi: 10.1016/j.xplc.2021.100246. eCollection 2022 Jan 10. Plant Commun. 2021. PMID: 35059627 Free PMC article. Review.
-
Should Root Plasticity Be a Crop Breeding Target?Front Plant Sci. 2020 May 15;11:546. doi: 10.3389/fpls.2020.00546. eCollection 2020. Front Plant Sci. 2020. PMID: 32499798 Free PMC article. Review.
-
Spatio-Temporal Variation in Water Uptake in Seminal and Nodal Root Systems of Barley Plants Grown in Soil.Front Plant Sci. 2020 Aug 13;11:1247. doi: 10.3389/fpls.2020.01247. eCollection 2020. Front Plant Sci. 2020. PMID: 32903494 Free PMC article.
-
Asymmetric auxin distribution establishes a contrasting pattern of aerenchyma formation in the nodal roots of Zea nicaraguensis during gravistimulation.Front Plant Sci. 2023 Apr 19;14:1133009. doi: 10.3389/fpls.2023.1133009. eCollection 2023. Front Plant Sci. 2023. PMID: 37152158 Free PMC article.
-
GhXB38D represses cotton fibre elongation through ubiquitination of ethylene biosynthesis enzymes GhACS4 and GhACO1.Plant Biotechnol J. 2023 Nov;21(11):2374-2388. doi: 10.1111/pbi.14138. Epub 2023 Aug 19. Plant Biotechnol J. 2023. PMID: 37596974 Free PMC article.
References
-
- Adamakis IDS, Panteris E, Eleftheriou EP. 2011. The fatal effect of tungsten on Pisum sativum L. root cells: indications for endoplasmic reticulum stress-induced programmed cell death. Planta 234: 21–34. - PubMed
-
- Bingham IJ. 2007. Quantifying the presence and absence of turgor for the spatial characterization of cortical senescence in roots of Triticum aestivum (Poacaea). American Journal of Botany 94: 2054–2058. - PubMed
-
- Borch K, Bouma TJ, Lynch JP, Brown KM. 1999. Ethylene: a regulator of root architectural responses to soil phosphorus availability. Plant, Cell and Environment 22: 425–431.
Publication types
MeSH terms
Substances
LinkOut - more resources
Full Text Sources
Other Literature Sources
