. 2018 Sep 15;34(18):3217-3219.
doi: 10.1093/bioinformatics/bty316.

CONICS integrates scRNA-seq with DNA sequencing to map gene expression to tumor sub-clones

Affiliations

CONICS integrates scRNA-seq with DNA sequencing to map gene expression to tumor sub-clones

Sören Müller et al. Bioinformatics. .

Abstract

Motivation: Single-cell RNA-sequencing (scRNA-seq) has enabled studies of tissue composition at unprecedented resolution. However, the application of scRNA-seq to clinical cancer samples has been limited, partly due to a lack of scRNA-seq algorithms that integrate genomic mutation data.

Results: To address this, we present.

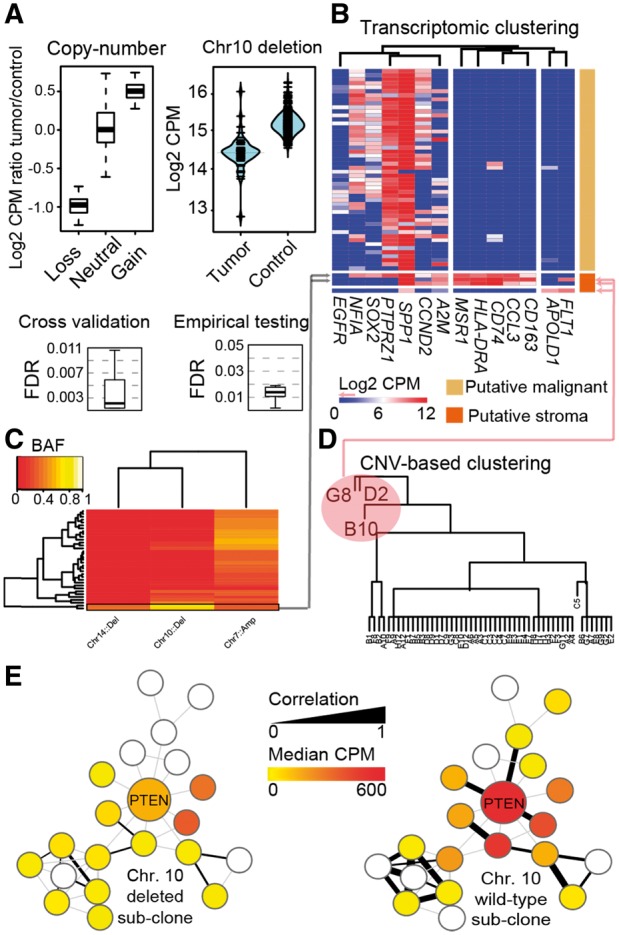
Conics: COpy-Number analysis In single-Cell RNA-Sequencing. CONICS is a software tool for mapping gene expression from scRNA-seq to tumor clones and phylogenies, with routines enabling: the quantitation of copy-number alterations in scRNA-seq, robust separation of neoplastic cells from tumor-infiltrating stroma, inter-clone differential-expression analysis and intra-clone co-expression analysis.

Availability and implementation: CONICS is written in Python and R, and is available from https://github.com/diazlab/CONICS.

Supplementary information: Supplementary data are available at Bioinformatics online.


Figures

Fig. 1.
Fig. 1.
An example of CONICS analysis on scRNA-seq and exome-seq of a glioblstoma biopsy. (A) CONICS quantifies CNVs in single cells with a controlled error rate: ScRNA-seq read-count correlations with CNV status (top left); scRNAseq read-count distributions for an example CNV (top right); FDR estimates in assigning CNV status to individual cells, computed via cross validation (bottom left) and via comparison to a control dataset (bottom right). (BD) CONICS estimates CNV allele frequency, which, when compared to the expression of canonical markers and clustering of CNV status, enables the rigorous separation of stromal /immune cells from neoplastic cells. (E) Co-expression network of PTEN, produced by CONICS, compared between cells with a chr. 10 loss and wild-type

Similar articles

Cited by

References

    1. Darmanis S. et al. (2015) A survey of human brain transcriptome diversity at the single cell level. Proc. Natl. Acad. Sci., 112, 7285–7290. - PMC - PubMed
    1. Diaz A. et al. (2016) SCell: integrated analysis of single-cell RNA-seq data. Bioinformatics, 32, 2219–2220. - PMC - PubMed
    1. Hou Y. et al. (2016) Single-cell triple omics sequencing reveals genetic, epigenetic, and transcriptomic heterogeneity in hepatocellular carcinomas. Cell Res., 26, 304–319. - PMC - PubMed
    1. Kharchenko P.V. et al. (2014) Bayesian approach to single-cell differential expression analysis. Nat. Methods, 11, 740–742. - PMC - PubMed
    1. Kim K.-T. et al. (2015) Single-cell mRNA sequencing identifies subclonal heterogeneity in anti-cancer drug responses of lung adenocarcinoma cells. Genome Biol., 16, 127.. - PMC - PubMed

Publication types

Substances