

Increased AIF-1-mediated TNF-α expression during implantation phase in IVF cycles with GnRH antagonist protocol
- PMID: 29897458
- PMCID: PMC6012176
- DOI: 10.1093/humrep/dey119
Increased AIF-1-mediated TNF-α expression during implantation phase in IVF cycles with GnRH antagonist protocol
Abstract
Study question: Is allograft inflammatory factor-1 (AIF-1), a cytokine associated with inflammation and allograft rejection, aberrantly elevated in in vitro fertilization (IVF) cycles with gonadotropin-releasing hormone (GnRH) antagonist protocol with potential effects on endometrial receptivity?
Summary answer: Our findings indicated AIF-1 is increased in IVF cycles with GnRH antagonist protocol and mediates greater TNF-α expression during implantation phase, which may be unfavorable for embryo implantation.
What is known already: Studies have shown that GnRH antagonist protocol cycles have lower implantation and clinical pregnancy rates than GnRH agonist long protocol cycles. Endometrial receptivity but not embryo quality is a key factor contributing to this phenomenon; however, the mechanism is still unknown.
Study design, size, duration: Implantation and pregnancy rates were studied in 238 patients undergoing their first cycle of IVF/ICSI between 2012 and 2014. Forty of these patients opted to have no fresh embryo replacement and were divided into two equal groups: (i) GnRH antagonist protocol and (ii) GnRH agonist long protocol, group 3 included 20 infertile women with a tubal factor in untreated cycles. During the same interval, endometrial tissues were taken from 18 infertile women with a tubal factor in the early proliferative phase, late proliferative phase, and mid-secretory phase of the menstrual cycle (n = 6/group).
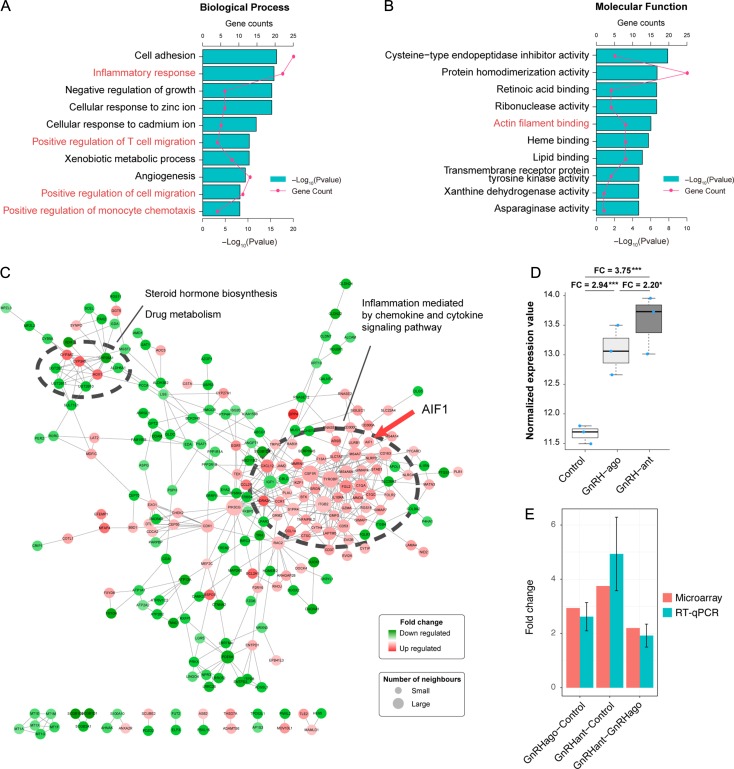
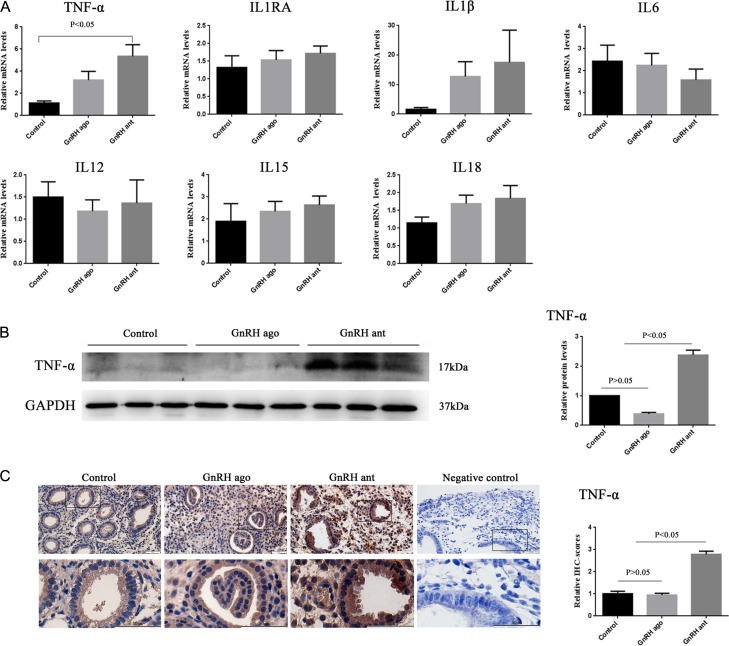
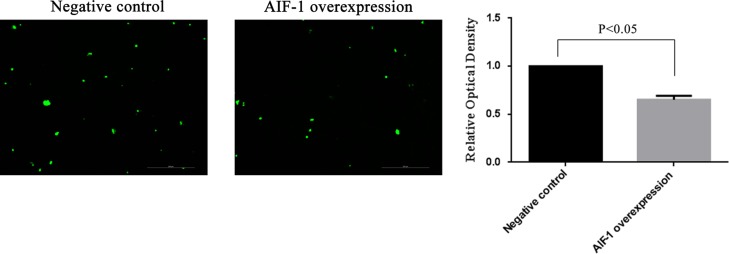
Participants/materials, setting, methods: Microarray analysis, RT-qPCR, Western blot analysis, immunohistochemistry were used to investigate the expression levels of AIF-1 and the related cytokines (TNF-α, IL1β, IL1RA, IL6, IL12, IL15 and IL18). The effect of AIF-1 on uterine receptivity was modeled using in vitro adhesion experiments (coculture of JAR cells and Ishikawa cells).
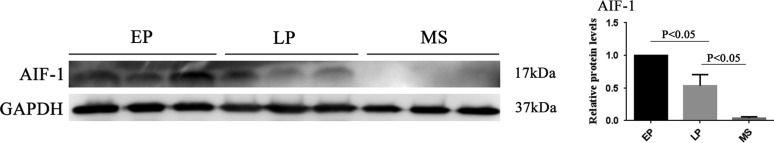
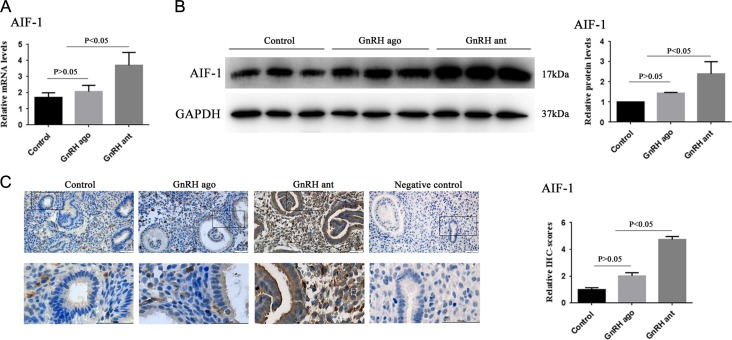
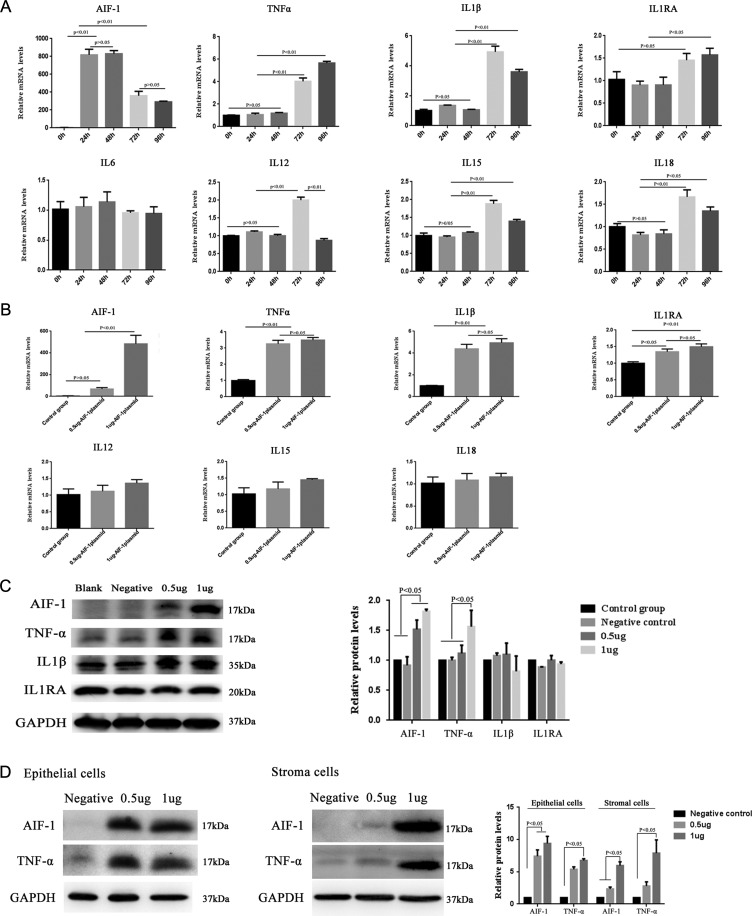
Main results and the role of chance: The expression of AIF-1 was the highest in early proliferative phase, decreasing thereafter in the late proliferative phase, and almost disappearing in the mid-secretory phase, indicating that low AIF-1 expression might be important for embryo implantation during implantation phase. Microarray results revealed that AIF-1 was upregulated in the antagonist group compared with the control group (fold change [FC] = 3.75) and the agonist (FC = 2.20) group. The raw microarray data and complete gene expression table were uploaded to GEO under the accession number of GSE107914. Both the mRNA and protein expression levels of AIF-1 and TNF-α were the higher in the antagonist group than in the other two groups (P < 0.05) which did not differ significantly (P > 0.05). The protein levels of TNF-α in both Ishikawa cells and primary endometrial cells were significantly increased (P < 0.05) at 96 h after transfection with the AIF-1 expression vector, indicating that TNF-α was mediated by AIF-1 in endometrial cells. Overexpression of AIF-1 in Ishikawa cells inhibited adhesion of JAR cells to them. Thus, increased AIF-1 might inhibit adhesion during implantation via raised TNF-α.
Limitations reasons for caution: The sample size of the microarray was small, which might weaken the accuracy of our results; however, the sample size of RT-qPCR and the Western blotting assays were sufficient to compensate for this deficiency in our study. In addition, the aberrant AIF-1 and thus TNF-α expression is one of many factors that may contribute to limiting implantation success. Therefore, further extensive in vitro mechanistic and in vivo animal studies are needed to assess the actual functional impact of this pathway.
Wider implications of the findings: Anti-TNF-α therapy might mitigate the adverse effects of GnRH antagonist on endometrial receptivity and improve the implantation rate in GnRH antagonist protocols in IVF.
Study funding/competing interests: This work was supported by grants from the National Natural Science Foundation of China, Grant numbers 81771656 and 81370763; Clinical research special fund of Chinese Medical Association, Grant number 16020480664; Shanghai Jiao Tong University Medicine-Engineering Fund, Grant number YG2017ZD11 and YG2017MS57; and the Merck-Serono China Research Fund for Fertility Agreement. P.C.K.L. is supported by a Canadian Institutes of Health Research Foundation Scheme Grant 143317. None of the authors has any competing interests.
Figures
References
-
- Al-Inany HG, Abou-Setta AM, Aboulghar M. Gonadotrophin-releasing hormone antagonists for assisted conception: a Cochrane review. Reprod Biomed Online 2007;14:640–649. - PubMed
-
- Debrock S, De Strooper B, Vander Perre S, Hill JA, D’Hooghe TM. Tumour necrosis factor-alpha, interleukin-6 and interleukin-8 do not promote adhesion of human endometrial epithelial cells to mesothelial cells in a quantitative in vitro model. Hum Reprod 2006;21:605–609. - PubMed
-
- Dimitriadis E, White CA, Jones RL, Salamonsen LA. Cytokines, chemokines and growth factors in endometrium related to implantation. Hum Reprod Update 2005;11:613–630. - PubMed
Publication types
MeSH terms
Substances
Grants and funding
LinkOut - more resources
Full Text Sources
Other Literature Sources
Medical
Molecular Biology Databases
Research Materials
Miscellaneous
