

Metabolism and Toxicity of Trichloroethylene and Tetrachloroethylene in Cytochrome P450 2E1 Knockout and Humanized Transgenic Mice
- PMID: 29897530
- PMCID: PMC6061689
- DOI: 10.1093/toxsci/kfy099
Metabolism and Toxicity of Trichloroethylene and Tetrachloroethylene in Cytochrome P450 2E1 Knockout and Humanized Transgenic Mice
Abstract
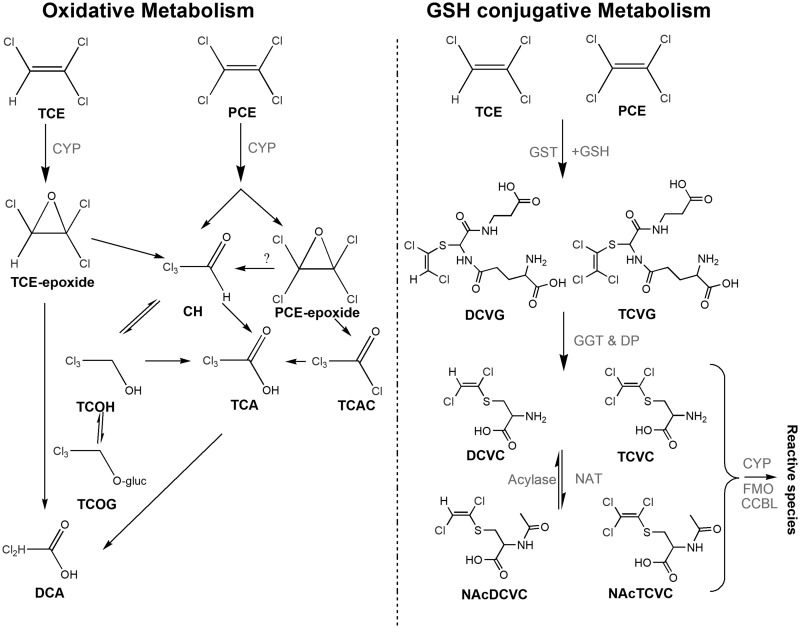
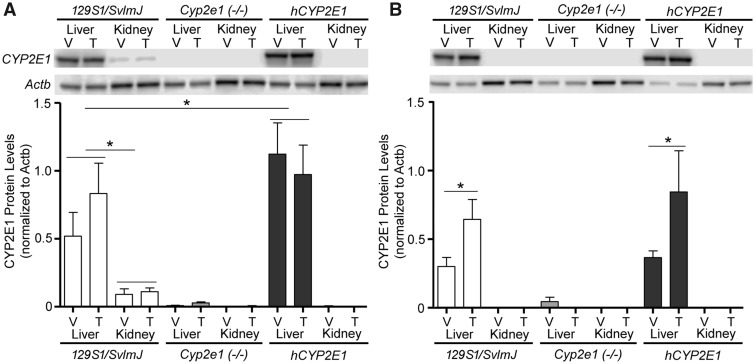
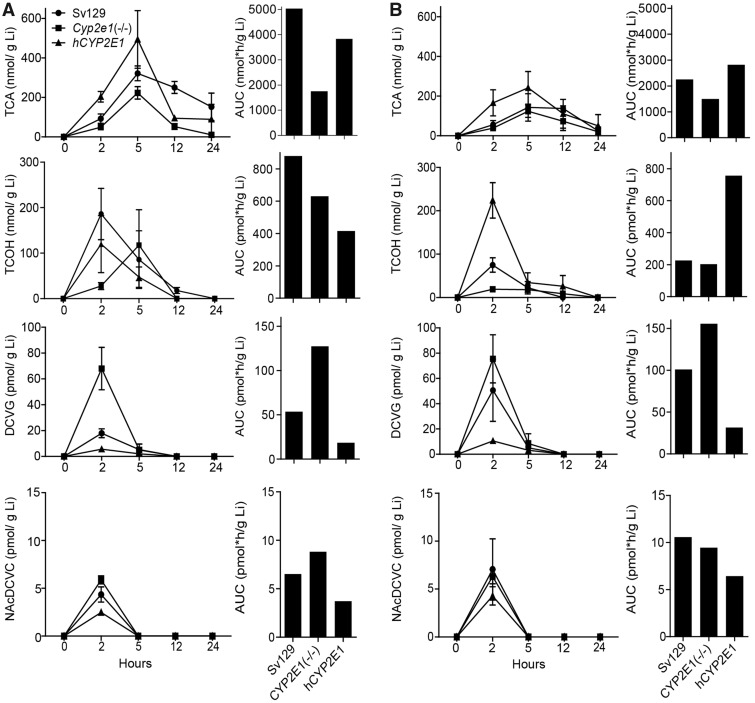
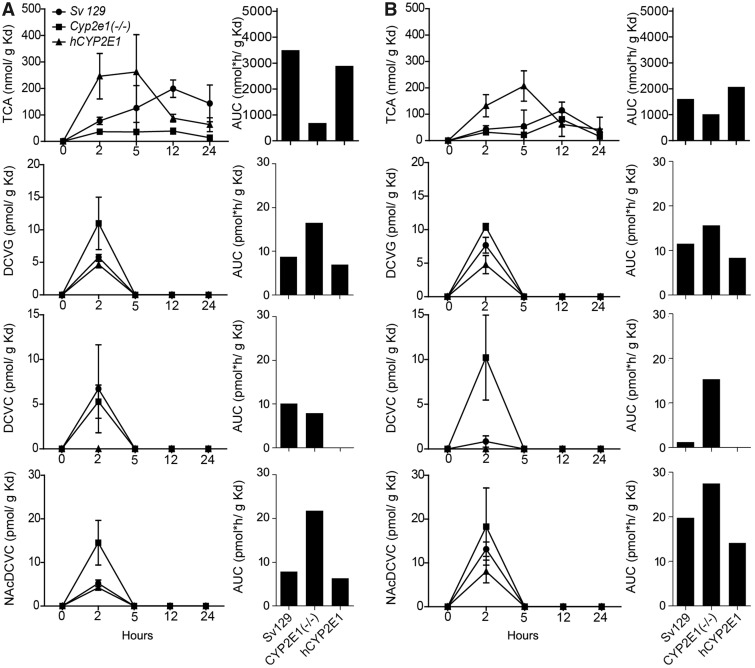
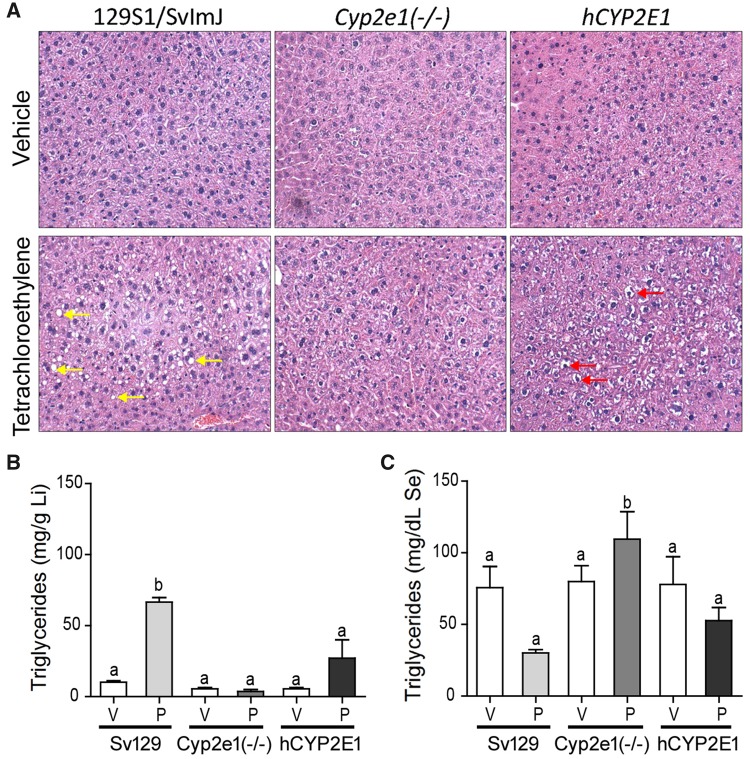
Trichloroethylene (TCE) and tetrachloroethylene (PCE) are structurally similar olefins that can cause liver and kidney toxicity. Adverse effects of these chemicals are associated with metabolism to oxidative and glutathione conjugation moieties. It is thought that CYP2E1 is crucial to the oxidative metabolism of TCE and PCE, and may also play a role in formation of nephrotoxic metabolites; however, inter-species and inter-individual differences in contribution of CYP2E1 to metabolism and toxicity are not well understood. Therefore, the role of CYP2E1 in metabolism and toxic effects of TCE and PCE was investigated using male and female wild-type [129S1/SvlmJ], Cyp2e1(-/-), and humanized Cyp2e1 [hCYP2E1] mice. To fill in existing gaps in our knowledge, we conducted a toxicokinetic study of TCE (600 mg/kg, single dose, i.g.) and a subacute study of PCE (500 mg/kg/day, 5 days, i.g.) in 3 strains. Liver and kidney tissues were subject to profiling of oxidative and glutathione conjugation metabolites of TCE and PCE, as well as toxicity endpoints. The amounts of trichloroacetic acid formed in the liver was hCYP2E1≈ 129S1/SvlmJ > Cyp2e1(-/-) for both TCE and PCE; levels in males were about 2-fold higher than in females. Interestingly, 2- to 3-fold higher levels of conjugation metabolites were observed in TCE-treated Cyp2e1(-/-) mice. PCE induced lipid accumulation only in liver of 129S1/SvlmJ mice. In the kidney, PCE exposure resulted in acute proximal tubule injury in both sexes in all strains (hCYP2E1 ≈ 129S1/SvlmJ > Cyp2e1(-/-)). In conclusion, our results demonstrate that CYP2E1 is an important, but not exclusive actor in the oxidative metabolism and toxicity of TCE and PCE.
Figures


Similar articles
-
Comparative analysis of metabolism of trichloroethylene and tetrachloroethylene among mouse tissues and strains.Toxicology. 2018 Nov 1;409:33-43. doi: 10.1016/j.tox.2018.07.012. Epub 2018 Jul 24. Toxicology. 2018. PMID: 30053492 Free PMC article.
-
Editor's Highlight: Comparative Dose-Response Analysis of Liver and Kidney Transcriptomic Effects of Trichloroethylene and Tetrachloroethylene in B6C3F1 Mouse.Toxicol Sci. 2017 Nov 1;160(1):95-110. doi: 10.1093/toxsci/kfx165. Toxicol Sci. 2017. PMID: 28973375 Free PMC article.
-
Trichloroethylene-induced formic aciduria: effect of dose, sex and strain of rat.Toxicology. 2013 Feb 8;304:49-56. doi: 10.1016/j.tox.2012.11.014. Epub 2012 Dec 1. Toxicology. 2013. PMID: 23211455
-
Target Organ Metabolism, Toxicity, and Mechanisms of Trichloroethylene and Perchloroethylene: Key Similarities, Differences, and Data Gaps.J Pharmacol Exp Ther. 2016 Oct;359(1):110-23. doi: 10.1124/jpet.116.232629. Epub 2016 Aug 10. J Pharmacol Exp Ther. 2016. PMID: 27511820 Free PMC article. Review.
-
Evaluation of the role of peroxisome proliferator-activated receptor alpha (PPARalpha) in mouse liver tumor induction by trichloroethylene and metabolites.Crit Rev Toxicol. 2008;38(10):857-75. doi: 10.1080/10408440802209796. Crit Rev Toxicol. 2008. PMID: 18821149 Review.
Cited by
-
Metabolic Signatures of the Exposome-Quantifying the Impact of Exposure to Environmental Chemicals on Human Health.Metabolites. 2020 Nov 10;10(11):454. doi: 10.3390/metabo10110454. Metabolites. 2020. PMID: 33182712 Free PMC article. Review.
-
Sex-Dependent Effects on Liver Inflammation and Gut Microbial Dysbiosis After Continuous Developmental Exposure to Trichloroethylene in Autoimmune-Prone Mice.Front Pharmacol. 2020 Oct 29;11:569008. doi: 10.3389/fphar.2020.569008. eCollection 2020. Front Pharmacol. 2020. PMID: 33250767 Free PMC article.
-
Renal Glutathione: Dual roles as antioxidant protector and bioactivation promoter.Biochem Pharmacol. 2024 Oct;228:116181. doi: 10.1016/j.bcp.2024.116181. Epub 2024 Mar 29. Biochem Pharmacol. 2024. PMID: 38556029 Review.
-
PBPK modeling of impact of nonalcoholic fatty liver disease on toxicokinetics of perchloroethylene in mice.Toxicol Appl Pharmacol. 2020 Aug 1;400:115069. doi: 10.1016/j.taap.2020.115069. Epub 2020 May 21. Toxicol Appl Pharmacol. 2020. PMID: 32445755 Free PMC article.
-
CYP2E1 in 1,4-dioxane metabolism and liver toxicity: insights from CYP2E1 knockout mice study.Arch Toxicol. 2024 Oct;98(10):3241-3257. doi: 10.1007/s00204-024-03811-5. Epub 2024 Aug 27. Arch Toxicol. 2024. PMID: 39192018
References
-
- Agency for Toxic Substances and Disease Registry (ATSDR). 2014. Draft Toxicological Profile for Tetrachloroethylene. U.S. Department of Health and Human Services, Public Health Service. Atlanta, GA.
-
- Buben J. A., O'Flaherty E. J. (1985). Delineation of the role of metabolism in the hepatotoxicity of trichloroethylene and perchloroethylene: A dose-effect study. Toxicol. Appl. Pharmacol. 78, 105–122. - PubMed
-
- Chiu W. A., Micallef S., Monster A. C., Bois F. Y. (2007). Toxicokinetics of inhaled trichloroethylene and tetrachloroethylene in humans at 1 ppm: Empirical results and comparisons with previous studies. Toxicol. Sci. 95, 23–36. - PubMed
-
- Chiu W. A., Okino M. S., Evans M. V. (2009). Characterizing uncertainty and population variability in the toxicokinetics of trichloroethylene and metabolites in mice, rats, and humans using an updated database, physiologically based pharmacokinetic (PBPK) model, and Bayesian approach. Toxicol. Appl. Pharmacol. 241, 36–60. - PubMed
Publication types
MeSH terms
Substances
Grants and funding
LinkOut - more resources
Full Text Sources
Other Literature Sources
