. 2018 Sep 1;165(1):74-89.
doi: 10.1093/toxsci/kfy124.

Dose-Related Severity Sequence, and Risk-Based Integration, of Chemically Induced Health Effects

Affiliations

Dose-Related Severity Sequence, and Risk-Based Integration, of Chemically Induced Health Effects

Salomon Sand et al. Toxicol Sci. .

Erratum in

Abstract

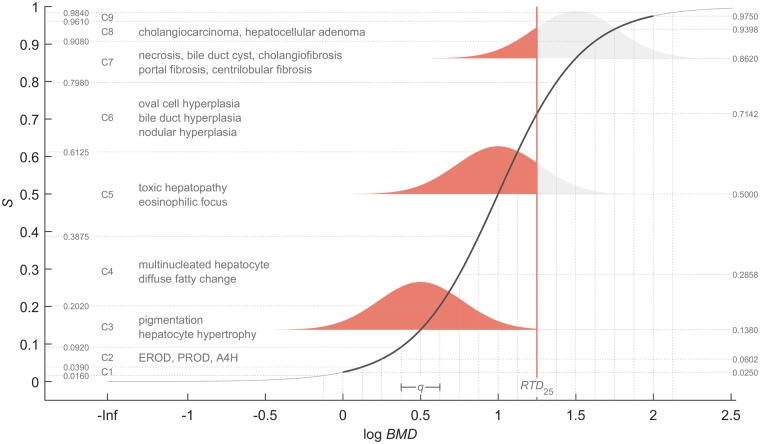
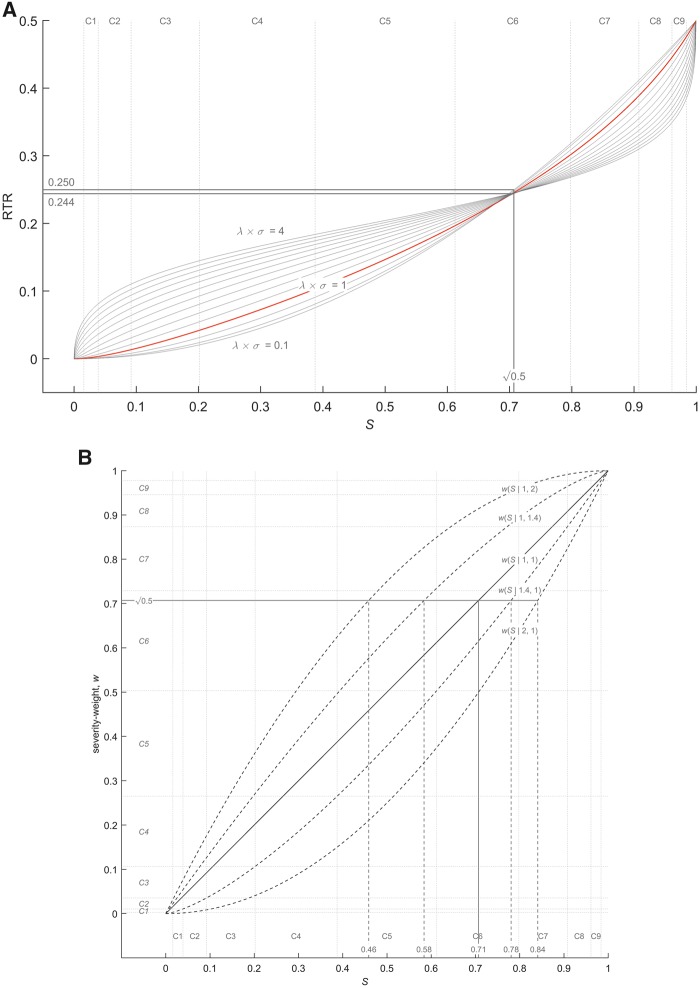
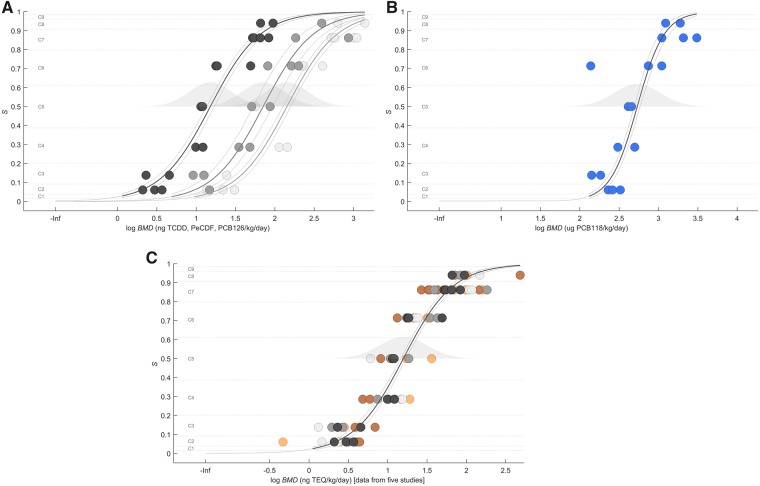
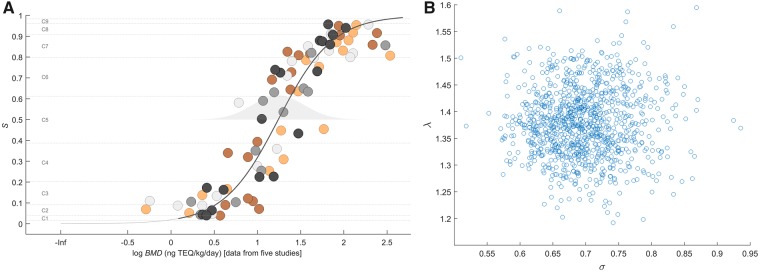
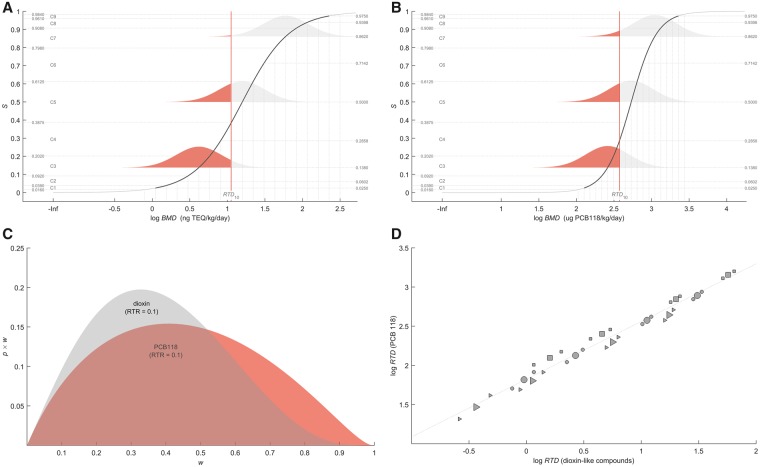
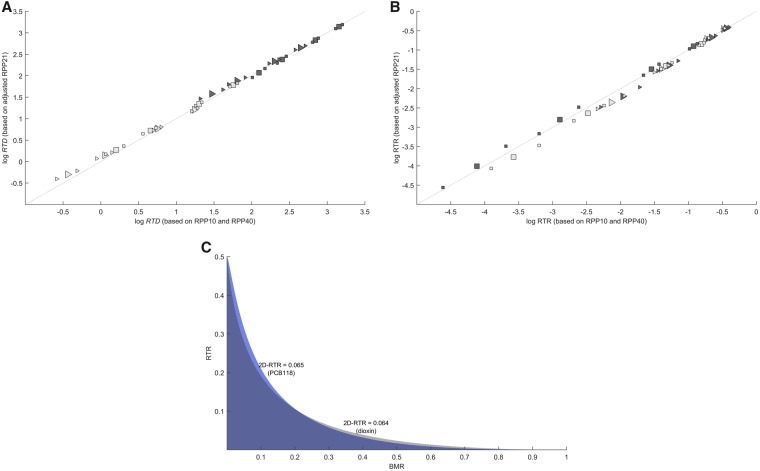
Risk assessment of chemical hazards is typically based on single critical health effects. This work aims to expand the current approach by characterizing the dose-related sequence of the development of multiple (lower- to higher-order) toxicological health effects caused by a chemical. To this end a "reference point profile" is defined as the relation between benchmark doses for considered health effects, and a standardized severity score determined for these effects. For a given dose of a chemical or mixture the probability for exceeding the reference point profile, thereby provoking lower- to higher-order effects, can be assessed. The overall impact at the same dose can also be derived by integrating contributions across all health effects following severity-weighting. In its generalized form the new impact metric relates to the probability of response for the most severe health effects. Reference points (points of departure) corresponding to defined levels of response can also be estimated. The proposed concept, which is evaluated for dioxin-like chemicals, provides an alternative for characterizing the low-dose region below the reference point for a severe effect like cancer. The shape and variability of the reference point profile add new dimensions to risk assessment, which for example extends the characterization of chemical potency, and the concept of acceptable effect sizes for individual health effects. Based on the present data the method shows high stability at low doses/responses, and is also robust to differences in severity categorization of effects. In conclusion, the novel method proposed enables risk-based integration of multiple dose-related health effects. It provides a first step towards a more comprehensive characterization of chemical toxicity, and suggests a potential for improved low-dose risk assessment.


Figures

Figure 1.
Figure 1.
Technical illustration of the RPP, which is a cross-section of the dose-severity-response volume. The RPP (s-shaped curve) describes the relation between the BMD for selected health effects, and the severity of toxicity (S) determined for these effects. Health effects are categorized by a 9-graded scale, C1–C9, for increasing severity of toxicity (Supplementary Table 2). Each severity category is mapped to an interval of S-values. For derivation of the default severity-weighting scheme, C1 and C9 are centered at S = 0.025 and S = 0.975, respectively, and S-intervals are then constructed in order to correspond to constant dose intervals, q, according to a logistic cumulative distribution function. The variation in the RPP is assumed to be normally distributed on the log-scale with constant variance. In this hypothetical example, the RPP model 1a location (Η), shape (λ), and standard deviation (σ) is 10, 1.6, and 0.625, respectively. The RPP characterizes the (low) dose region below the BMDs for the most severe health effects. Areas (fractions of the normal distribution) describe probabilities, p, for exceeding the RPP, provoking lower- to higher-order toxicological effects, at an exposure level corresponding to the vertical line. In this example the vertical line represents RTD25 which is the dose corresponding to a RTR of 0.25 (50%). The RTR is the average severity-weighted probability of exceeding the RPP on the interval S = 0 to S = 1 (equation 3).
Figure 2.
Figure 2.
(A) The relation between the severity of toxicity, S, and the RTR, according to RPP model 1a. This relation depends on the product between the RPP shape (λ) and standard deviation (σ): λ × σ = 1 represents the RPP in Figure 1. The S-value (S-25) corresponding to RTR ≈ 0.25 (50%) is independent of the RPP model parameters. S-25 is associated with the center of the toxicological process, or sequence of effects, studied, in terms of RTR. For a linear severity-weight S = √0.5 (close to the midpoint of C6) corresponds to RTR ≈ 0.244 (minimum) for λ · σ ≈ 2, and the RTR approaches 0.250 (maximum) as λ · σ decreases or increase from ≈ 2. (For model 1b the corresponding values are 0.250 and 0.258, and for RPP model 1c the corresponding values are 0.237 and 0.250, data not shown). (B) Illustration of linear (solid line) and nonlinear (dotted curves) severity-weights, w(Sij|a,b), that follow a beta cumulative distribution function. S-25 corresponding to RTR ≈ 0.25 (50%) is illustrated for each severity-weight. S-25 is higher than √0.5 when a > 1 and b = 1. This corresponds to a negatively skewed mapping of severity categories to S. The opposite results for a = 1 and b > 1. The value of w at S = 0.5, w(0.5|a,b), describes skewness, which is 0.25, 0.38, 0.5, 0.62, and 0.75 for (a, b) equal to (2, 1), (1.4, 1), (1, 1), (1, 1.4), and (1, 2), respectively. The grid illustrates how S-intervals associated with severity category C1 to C9 indirectly becomes modified in the case of w(Sij|1.4, 1).
Figure 3.
Figure 3.
RPP21 model 1a for dioxin-like chemicals and mixtures. Circles correspond to BMD21 point estimates (x-axis) for liver effects classified in severity categories C2–C8 that are linked to quantitative values of S (y-axis) (as an example circles are plotted at a central location in the S-intervals associated with C2–C8). Solid curves describe central RPP point estimates with 2-sided 90% CIs, and gray distributions describe the median RPP21 variability, across 1000 iterations. (A) RPP21 with chemical-specific location, Η, and common shape, λ (and standard deviation, σ), across chemicals: TCDD (dark), PeCDF (gray), PCB126 (light). (B) RPP for PCB118. (C) Dioxin RPP21 with common model parameters (Η, λ, and σ) across 5 chemicals/mixtures: TCDD (dark), PeCDF (gray), PCB126 (light), PCB126: PCB118 (orange, dark), and TCDD: PeCDF: PCB126 (orange, light).
Figure 4.
Figure 4.
(A) One iteration of the algorithm used for estimating dioxin RPP21 model 1a (see Figure 3C) that provides estimates of the RPP shape (λ^ = 1.37) and standard deviation (σ^ = 0.68) close to median values (see Supplementary Table 6). Each circle represents a simulated pair of BMD and S-values. Color codes as in Figure 3C. (B) Correlation between λ^ and σ^ cross all 1, 000 iterations.
Figure 5.
Figure 5.
(A) RPP21 (model 1a) for dioxin-like chemicals and (B) RPP21 (model 1a) for PCB118 where vertical lines represent RTD10 point estimates. (C) RTRs (area under curve) associated with RTD10. (D) Comparison of RTDs for dioxin-like chemicals (units in ng TEQ/kg/day) and RTDs for PCB118 (units in µg/kg/day). Circles, triangles, and squares represent RTDs, corresponding RTRs of 0.25, 0.1, 0.01, and 0.001, derived from RPP21, RPP10, and RPP40 (model 1a), respectively. The relative potency is not constant since slopes of the underlying dose-response curves differ, and also due to differences in RPP shapes (Figs. 5A and 5B). Large symbols represent RTD point estimates, and small symbols represent RTD lower and upper bounds. The coefficient of determination, R2, is 0.98 for a linear model (dotted line) fitted to RTD point estimates.
Figure 6.
Figure 6.
Results associated with the generalized methodology for RPP characterization that adjusts the estimated RPP21 (model 1a) to describe RPPs associated with specified BMR levels using an indirect/approximate approach (see Supplementary Material). (A) Correlation between RTDs based on RPP10/RPP40 (model 1a) and corresponding RTDs from the approximate approach. Triangles and squares are results associated with BMRs of 0.1 and 0.4, respectively. Light symbols represent dioxin-like chemicals, and dark symbols represent PCB118. Large symbols are point estimates, and small symbols are lower and upper bounds. RTDs correspond to RTRs of 0.25, 0.1, 0.01, and 0.001. (B) Correlation between RTRs based on RPP10/RPP40 and corresponding RTRs from the approximate approach. Symbol representation as in (A). RTRs correspond to exposures (RTD point estimates in Table 1) of 31, 11, 2.7, and 0.95 ng TEQ/kg/day for dioxin-like chemicals, and 781, 377, 134, and 66 μg/kg/day for PCB118. (C) RTRs estimated across BMR = 0–1 according to the generalized methodology for RPP characterization. RTRs are associated with exposures, E = 11 ng TEQ/kg/day for dioxin-like chemicals and E = 377 μg/kg/day for PCB118 (RTD10 in Table 1). The RTR integrated across BMR levels, 2D-RTR, is 0.064 (dioxin-like chemicals) and 0.065 (PCB118), respectively. This is regarded to describe impacts similar to that associated with an (average) probability of response of about 6% for the most severe (C8–C9) health effects.

Similar articles

Cited by

  • Guidance on risk-benefit assessment of foods.
    EFSA Scientific Committee; More SJ, Benford D, Hougaard Bennekou S, Bampidis V, Bragard C, Halldorsson TI, Hernández-Jerez AF, Koutsoumanis K, Lambré C, Machera K, Mullins E, Nielsen SS, Schlatter J, Schrenk D, Turck D, Naska A, Poulsen M, Ranta J, Sand S, Wallace H, Bastaki M, Liem D, Smith A, Ververis E, Zamariola G, Younes M. EFSA Scientific Committee, et al. EFSA J. 2024 Jul 16;22(7):e8875. doi: 10.2903/j.efsa.2024.8875. eCollection 2024 Jul. EFSA J. 2024. PMID: 39015302 Free PMC article.
  • A value of information framework for assessing the trade-offs associated with uncertainty, duration, and cost of chemical toxicity testing.
    Hagiwara S, Paoli GM, Price PS, Gwinn MR, Guiseppi-Elie A, Farrell PJ, Hubbell BJ, Krewski D, Thomas RS. Hagiwara S, et al. Risk Anal. 2023 Mar;43(3):498-515. doi: 10.1111/risa.13931. Epub 2022 Apr 22. Risk Anal. 2023. PMID: 35460101 Free PMC article.
  • Development of an Evidence-Based Risk Assessment Framework.
    Krewski D, Saunders-Hastings P, Baan RA, Barton-Maclaren TS, Browne P, Chiu WA, Gwinn M, Hartung T, Kraft AD, Lam J, Lewis RJ, Sanaa M, Morgan RL, Paoli G, Rhomberg L, Rooney A, Sand S, Schünemann HJ, Straif K, Thayer KA, Tsaioun K. Krewski D, et al. ALTEX. 2022;39(4):667-693. doi: 10.14573/altex.2004041. Epub 2022 Sep 1. ALTEX. 2022. PMID: 36098377 Free PMC article.

References

    1. Andersen M. E., Krewski D. (2010). The vision of toxicity testing in the 21st century: Moving from discussion to action. Toxicol. Sci. 117, 17–24. - PubMed
    1. Ankley G. T., Bennett R. S., Erickson R. J., Hoff D. J., Hornung M. W., Johnson R. D., Mount D. R., Nichols J. W., Russom C. L., Schmieder P. K., et al. (2010). Adverse outcome pathways: A conceptual framework to support ecotoxicology research and risk assessment. Environ. Toxicol. Chem. 29, 730–741. - PubMed
    1. Becker R. A., Patlewicz G., Simon T. W., Rowlands J. C., Budinsky R. A. (2015). The adverse outcome pathway for rodent liver tumor promotion by sustained activation of the aryl hydrocarbon receptor. Reg. Toxicol. Pharmacol. 73, 172–190. - PubMed
    1. Bhattacharya S., Zhang Q., Carmichael P., Boekelheide K., Andersen M. (2011). Toxicity testing in the 21st century: Defining new risk assessment approaches based on pertubation of intracellular toxicity pathways. PLoS One 6, e20887.. - PMC - PubMed
    1. Bogdanffy M. S., Daston G., Faustman E. M., Kimmel C. A., Kimmel G. L., Seed J., Vu V. (2001). Harmonization of cancer and noncancer risk assessment: Proceedings of a consensus-building workshop. Toxicol. Sci. 61, 18–31. - PubMed

Publication types

Substances