. 2018 Jun 13;13(6):e0197350.
doi: 10.1371/journal.pone.0197350. eCollection 2018.

Traditional and systems biology based drug discovery for the rare tumor syndrome neurofibromatosis type 2

Affiliations

Traditional and systems biology based drug discovery for the rare tumor syndrome neurofibromatosis type 2

Synodos for NF2 Consortium et al. PLoS One. .

Abstract

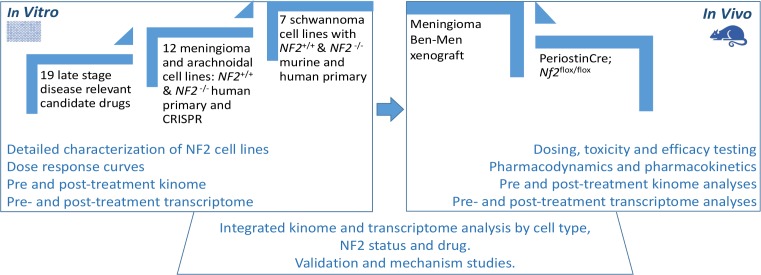
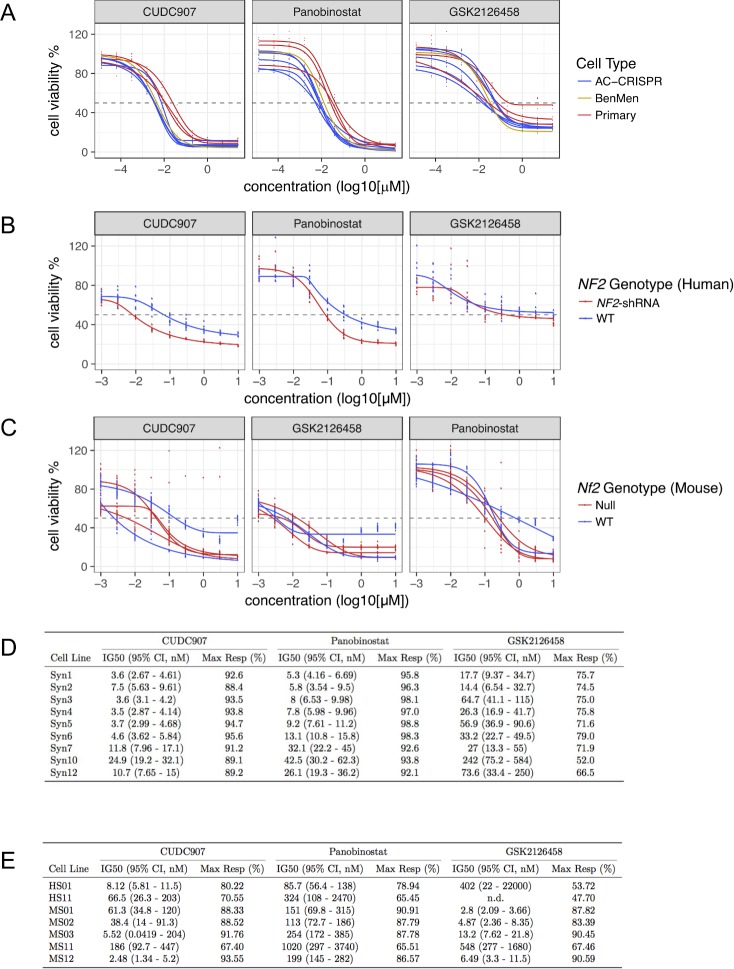
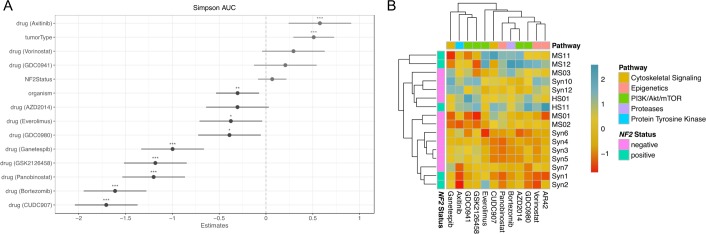
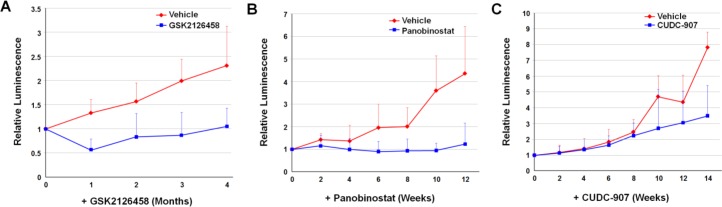
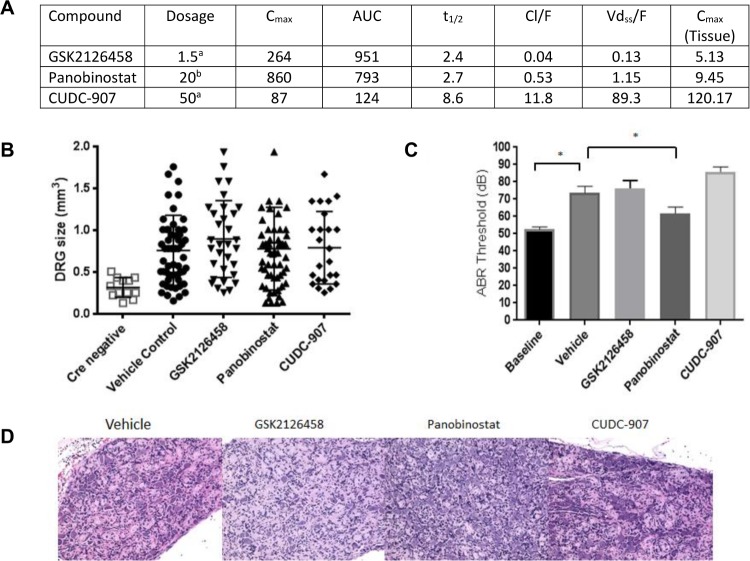
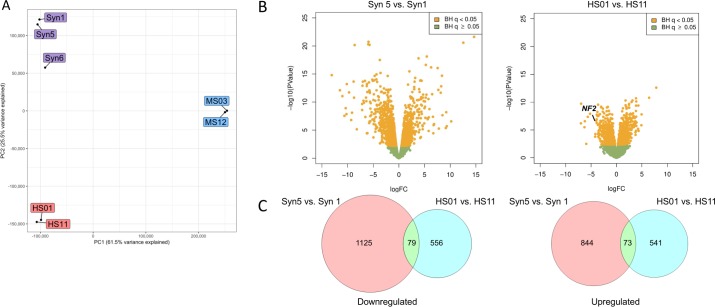
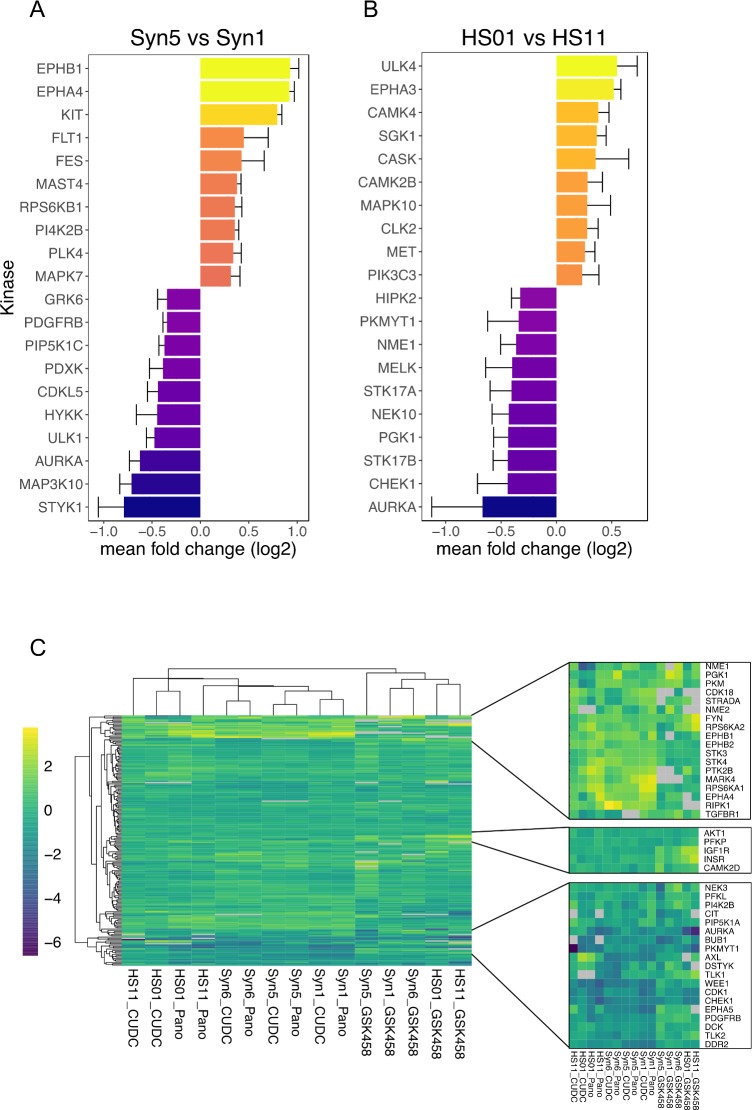
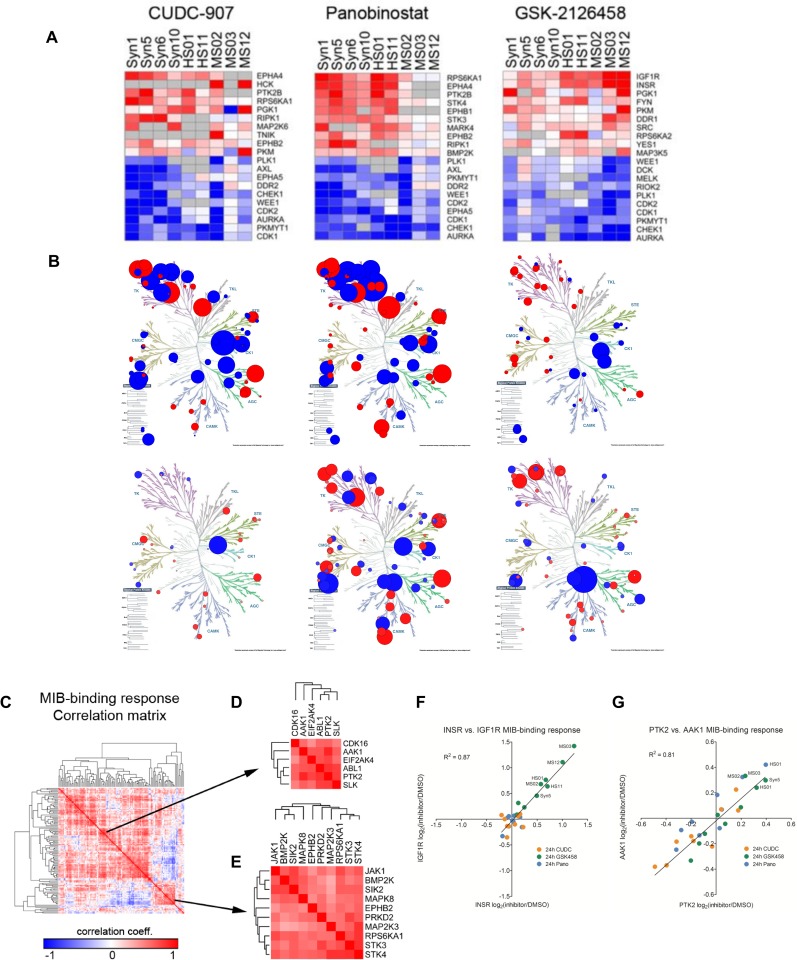
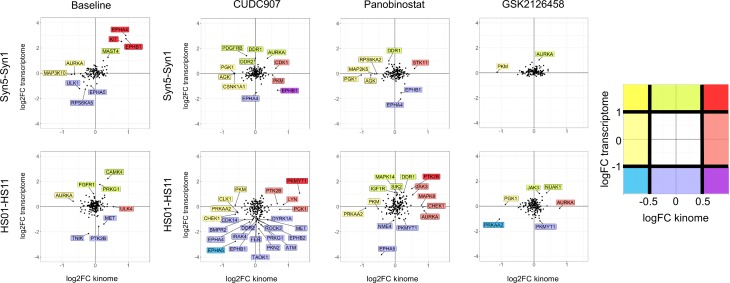
Neurofibromatosis 2 (NF2) is a rare tumor suppressor syndrome that manifests with multiple schwannomas and meningiomas. There are no effective drug therapies for these benign tumors and conventional therapies have limited efficacy. Various model systems have been created and several drug targets have been implicated in NF2-driven tumorigenesis based on known effects of the absence of merlin, the product of the NF2 gene. We tested priority compounds based on known biology with traditional dose-concentration studies in meningioma and schwann cell systems. Concurrently, we studied functional kinome and gene expression in these cells pre- and post-treatment to determine merlin deficient molecular phenotypes. Cell viability results showed that three agents (GSK2126458, Panobinostat, CUDC-907) had the greatest activity across schwannoma and meningioma cell systems, but merlin status did not significantly influence response. In vivo, drug effect was tumor specific with meningioma, but not schwannoma, showing response to GSK2126458 and Panobinostat. In culture, changes in both the transcriptome and kinome in response to treatment clustered predominantly based on tumor type. However, there were differences in both gene expression and functional kinome at baseline between meningioma and schwannoma cell systems that may form the basis for future selective therapies. This work has created an openly accessible resource (www.synapse.org/SynodosNF2) of fully characterized isogenic schwannoma and meningioma cell systems as well as a rich data source of kinome and transcriptome data from these assay systems before and after treatment that enables single and combination drug discovery based on molecular phenotype.


Conflict of interest statement

The authors have declared that no competing interests exist.

Figures

Fig 1
Fig 1. Schematic diagram for drug testing with mechanistically based candidate drugs in a traditional in vitro to in vivo pipeline and simultaneous integrated transcriptome and kinome analysis of cells and murine tumors.
Fig 2
Fig 2. Treatment response of merlin-wildtype and merlin-deficient cells with compounds meeting efficacy metrics.
(A) 72-hour dose response curves (DRCs) were generated for the human meningioma-relevant cell panel including all AC-CRISPR (blue), immortalized Ben-Men1 (Syn6, yellow), and 3 primary MN lines (red). (B) 48-hour DRCs for human SC including merlin-deficient (red) and merlin-wildtype (WT, blue) lines are shown. (C) DRCs generated for mouse SC/schwannoma-related lines including merlin-deficient (red) and merlin-wildtype (WT, blue) are also shown. All DRCs are expressed as percent cell viability (cell viability %) relative to vehicle treatment. Drug concentrations are expressed as log10 (μM) scale. (D) Dose-response metrics in AC, MN and (E) SC/schwannoma lines of compounds meeting efficacy metrics.
Fig 3
Fig 3. Drug screening outcomes are largely independent of merlin status.
(A) Estimated beta coefficients of different assay variables to differences in area under the curve (AUC) as determined by multiple linear modeling. Multiple linear modeling indicates that unlike merlin status, tumor type and treatment with a subset of drugs (CUDC-907, Bortezomib, Panobinostat, GSK2126458, Ganetespib, and Axitinib) are significantly associated with a reduction in cell viability as measured by Simpson AUC. (B) Hierarchical clustering demonstrates similarity of response (Simpson AUC) of all cell lines to tested drugs. Only drugs common to both cell types were included in the analysis. Based on the response of each cell line to the entire panel of drugs, the cell lines appear to cluster by cell type and merlin status.
Fig 4
Fig 4. Anti-tumor efficacies of GSK2126458, Panobinostat, and CUDC-907 in the quantifiable, orthotopic, merlin-deficient benign meningioma model.
Luciferase-expressing Ben-Men-1-LucB cells were stereotactically injected at the skull base, and mice with established tumors were randomized into three groups for treatment by oral gavage as described in Methods. (A) One half of the first group of mice was treated with GSK2126458 and the other half fed the vehicle used for drug formulation (n = 8 each). (B-C) Likewise, the second group of mice was treated with (B) Panobinostat or the vehicle, and the third group was fed CUDC-907 or (C) the formulating vehicle. Tumor growth was monitored by BLI and the relative bioluminescence signals emitted from tumors in mice were quantified and denoted as the percentage of total flux after treatment relative to the total flux prior to treatment designated as one (100%). Shown are the data as mean ± standard deviation.
Fig 5
Fig 5. In vivo testing in schwannoma.
Nf2 flox/flox; Postn cre+ mice were treated for 12 weeks at the maximum tolerated dose, beginning at 6 months of age. (A) Pharmacokinetics of GSK2126458, Panobinostat and CUDC-907 in PostnCre; Nf2floxflox mice. Dosage is reported in (a) PO mg/kg/day, (b) IP mg/kg 3x/week. Cmax is reported in ng/ml. AUC reported as ng/ml/h. t1/2 reported in hours. Cl/F reported as L/Hr. Vdss/F reported as L. Cmax tissue reported as ng/g of tissue. (B) Dorsal root ganglion (DRG) size was measured by dial caliper; each data point represents one individual DRG location. Four individual DRG locations were measured per mouse; (C) ABR threshold was measured before and after 12 weeks treatment. ABR threshold was significantly increased after 12 weeks with treatment (p>0.0001) by one-way ANOVA. (D) Paraffin-embedded slides of DRG from treatment mice were stained with hematoxylin and eosin (H&E).
Fig 6
Fig 6. PCA and transcriptomic differences due to merlin deficiency in human AC and SC.
(A) Principal components analysis (PCA) of averaged, rank-normalized read counts (overlapping genes only) from RNA-seq of wild type and merlin-deficient human SC (red), mouse SC (orange), human AC (blue, Syn5, Syn1) and human MN cells (blue, Syn6). PC1 explains 61.5% of variance, while PC2 explains 25.5% of variance. (B) Volcano plots showing the significance and log2 fold-change (logFC) due to merlin deficiency for all gene transcripts reliably detected in the RNA-seq analysis. Yellow dots represent genes altered at [47] adjusted significance of P<0.05. The location of the downregulated NF2 gene, corresponding with ~7% of normal NF2 expression, is labelled for HS01 vs HS11. In the Syn5 vs Syn1 AC comparison, fold-comparisons across the entire gene are not meaningful as there is no significant difference in the level of NF2 transcripts in Syn5, but these produce no active merlin due to absence of exon 8 (S5 Fig), which was removed by CRISPR/Cas9. (C) Venn diagrams showing the relatively small degree of overlap between the downregulated (left) and upregulated genes (right) due to merlin deficiency in human AC and SC, respectively.
Fig 7
Fig 7. Kinome changes across human isogenic merlin-wildtype and -deficient AC and SC pairs.
(A-B) Top baseline kinome changes across human AC and SC isogenic pairs. Data presented are the mean log2 fold change from 3 experiments, error bars are standard error. (C) Pan-kinome (left) drug induced perturbations relative to DMSO control contain clusters of induced/repressed kinases (right). Each condition is the median log 2 fold change of three replicate experiments relative to vehicle (DMSO) control, with any kinase having >33% non-detection rate removed (grey: kinase not detected in any run). Cell lines treated with HDAC inhibitors (Panobinostat and CUDC-907) cluster most closely.
Fig 8
Fig 8. Kinomic response to drug treatment.
(A) Ranking the top 10 most-induced and most-suppressed kinases for each of the treatments at 24 hours stresses the similarities in drug response across cell lines, and also the differences between human and mouse cell lines. (B) Drug induced perturbations in HS-01 and Syn5 shown in a kinome tree plot. (C) Kinases that were represented in every cell line were used to generate a MIB-binding response correlation matrix. (D-E) Two of the most-prominent clusters include kinases highly-correlated with PTK2 (FAK1) or RPS6KA1 (p90 RSK) and STK3/4. (F) The most-highly correlated kinases are INSR and IGF1R (corr = 0.91), primarily being induced by GSK458-treatment at 24 hours. (G) The next-most correlated kinase pair across the entire dataset is PTK2 and AAK1 (corr = 0.87). Interestingly, these kinases are preferentially induced in merlin-deficient cell lines.
Fig 9
Fig 9
Integrative analysis of kinome and transcriptome data at baseline (left) and after drug treatment (right) with CUDC-907, Panobinostat, or GSK2126458. In comparisons at baseline or after drug treatment. Kinases are plotted as black dots based upon the log2 fold difference (logFC) in their activity and transcript level between similarly treated merlin-deficient and merlin-wildtype human isogenic cell pairs, Syn5 vs. Syn1 for AC and HS01 vs. HS11 for SC. Kinases showing a difference of logFC <-0.5 or > 0.5 in kinase activity and/or logFC <-1 or >1 in transcript level are labelled and colored based upon the color code scheme to the right of the graphs (e.g., relatively greater in merlin-deficient cells compared to merlin-wildtype cells than the stated thresholds in both kinase activity and transcriptome data = dark red; relatively greater only in kinase activity = light red, etc.).

References

    1. Evans DG. Neurofibromatosis type 2. Handb Clin Neurol. 2015;132: 87–96. doi: 10.1016/B978-0-444-62702-5.00005-6 - DOI - PubMed
    1. Hexter A, Jones A, Joe H, Heap L, Smith MJ, Wallace AJ, et al. Clinical and molecular predictors of mortality in neurofibromatosis 2: a UK national analysis of 1192 patients. J Med Genet. 2015;52: 699–705. doi: 10.1136/jmedgenet-2015-103290 - DOI - PubMed
    1. Ostrom QT, Gittleman H, de Blank PM, Finlay JL, Gurney JG, McKean-Cowdin R, et al. American Brain Tumor Association Adolescent and Young Adult Primary Brain and Central Nervous System Tumors Diagnosed in the United States in 2008–2012. Neuro Oncol. 2016;18 Suppl 1: i1–i50. - PMC - PubMed
    1. Domingues P, Gonzalez-Tablas M, Otero A, Pascual D, Ruiz L, Miranda D, et al. Genetic/molecular alterations of meningiomas and the signaling pathways targeted. Oncotarget. 2015;6: 10671–10688. doi: 10.18632/oncotarget.3870 - DOI - PMC - PubMed
    1. Mallory GW, Pollock BE, Foote RL, Carlson ML, Driscoll CL, Link MJ. Stereotactic radiosurgery for neurofibromatosis 2-associated vestibular schwannomas: toward dose optimization for tumor control and functional outcomes. Neurosurgery. 2014;74: 292–300; discussion 300–1. doi: 10.1227/NEU.0000000000000264 - DOI - PubMed

Publication types

MeSH terms