. 2018 Sep;48(9):1492-1505.
doi: 10.1002/eji.201747360. Epub 2018 Jun 26.

BATF regulates the expression of Nfil3, Wnt10a and miR155hg for efficient induction of antibody class switch recombination in mice

Affiliations

BATF regulates the expression of Nfil3, Wnt10a and miR155hg for efficient induction of antibody class switch recombination in mice

Rosemary E Morman et al. Eur J Immunol. 2018 Sep.

Abstract

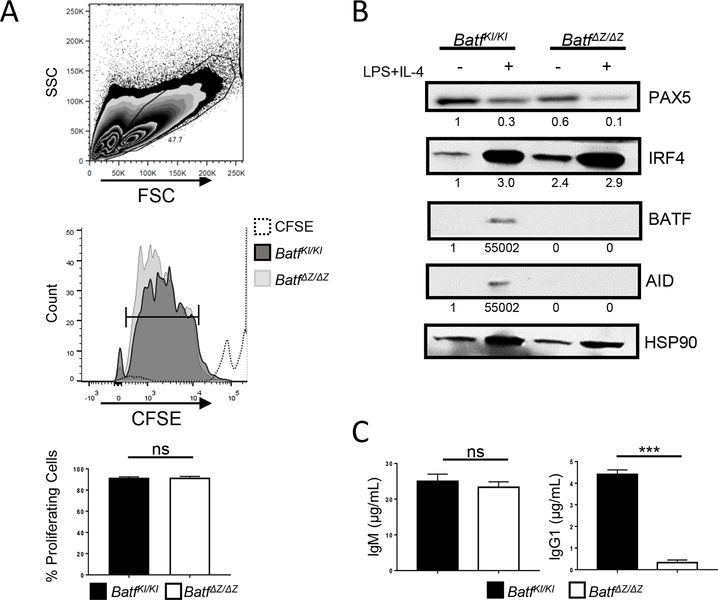
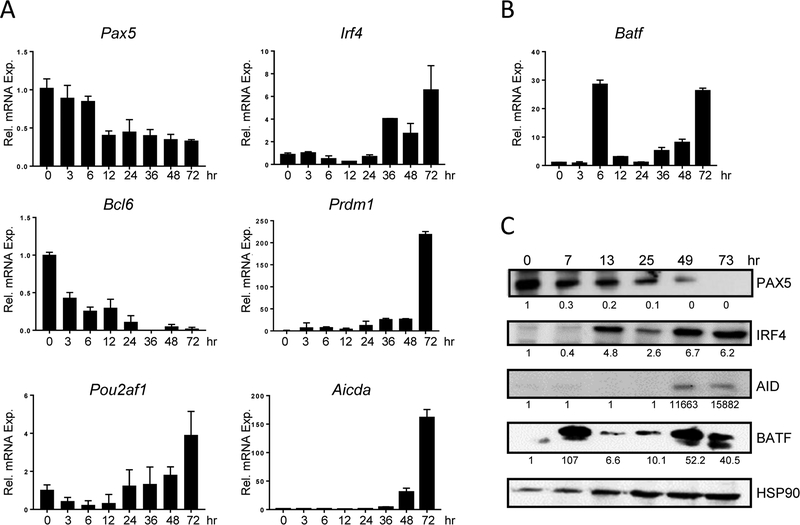
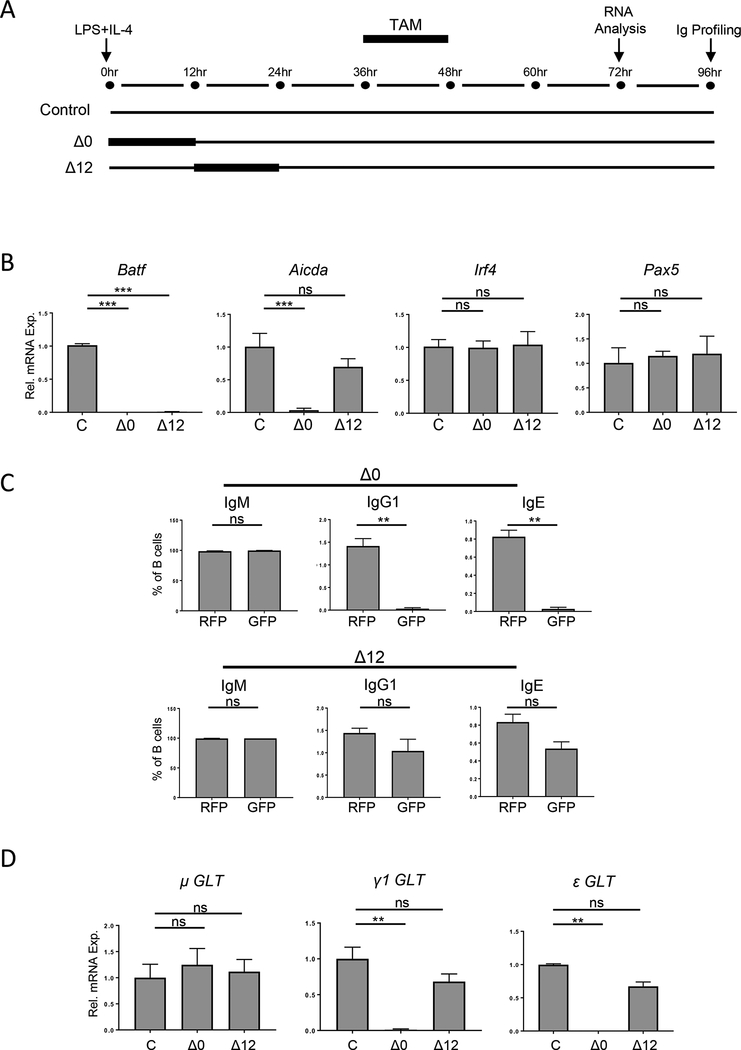
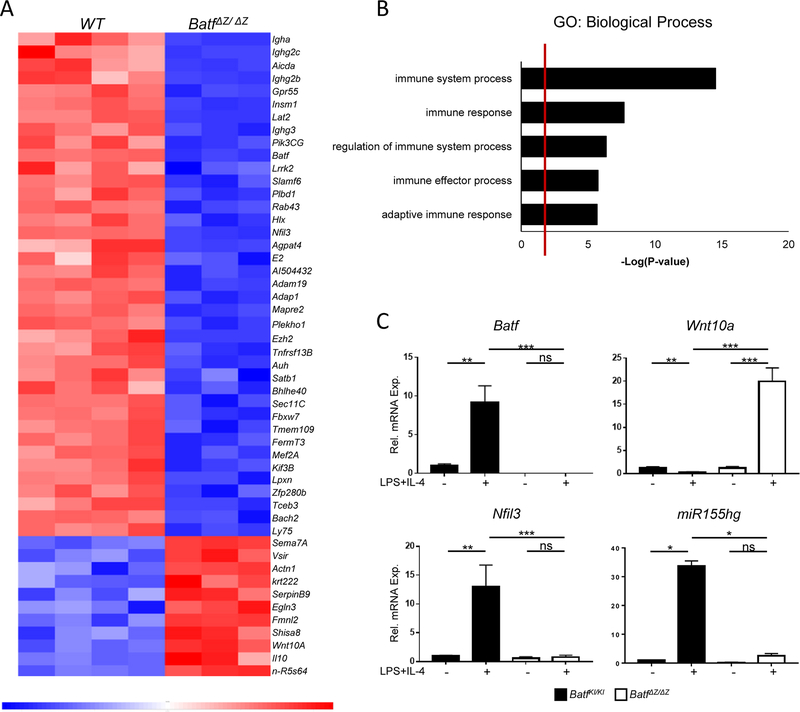
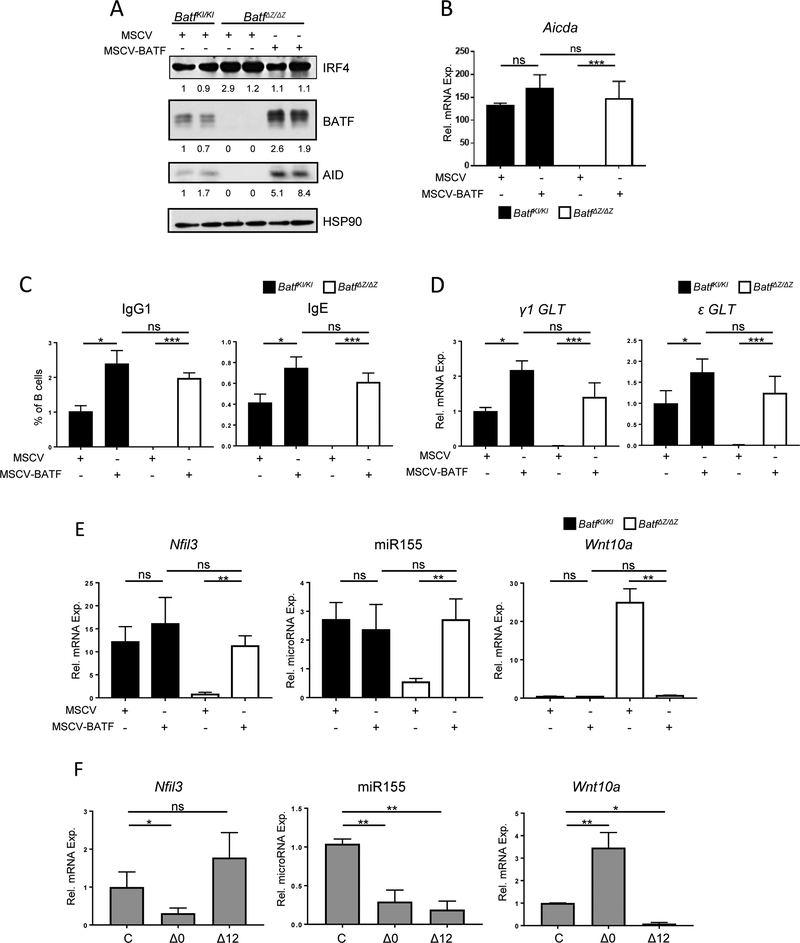
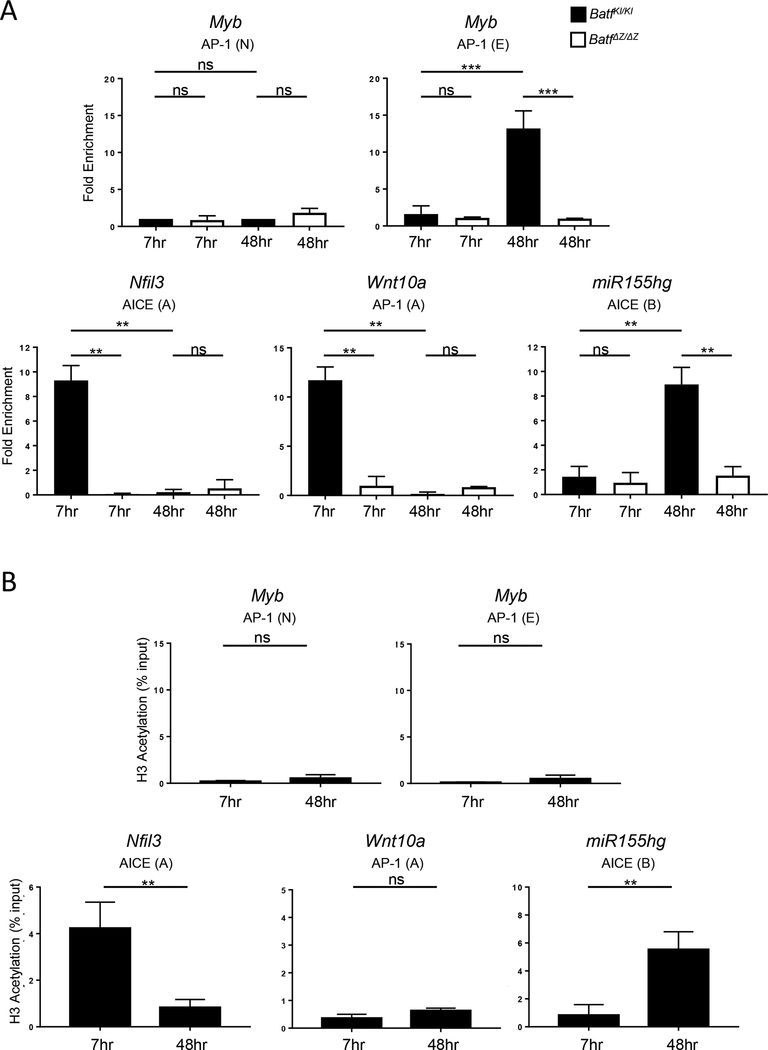
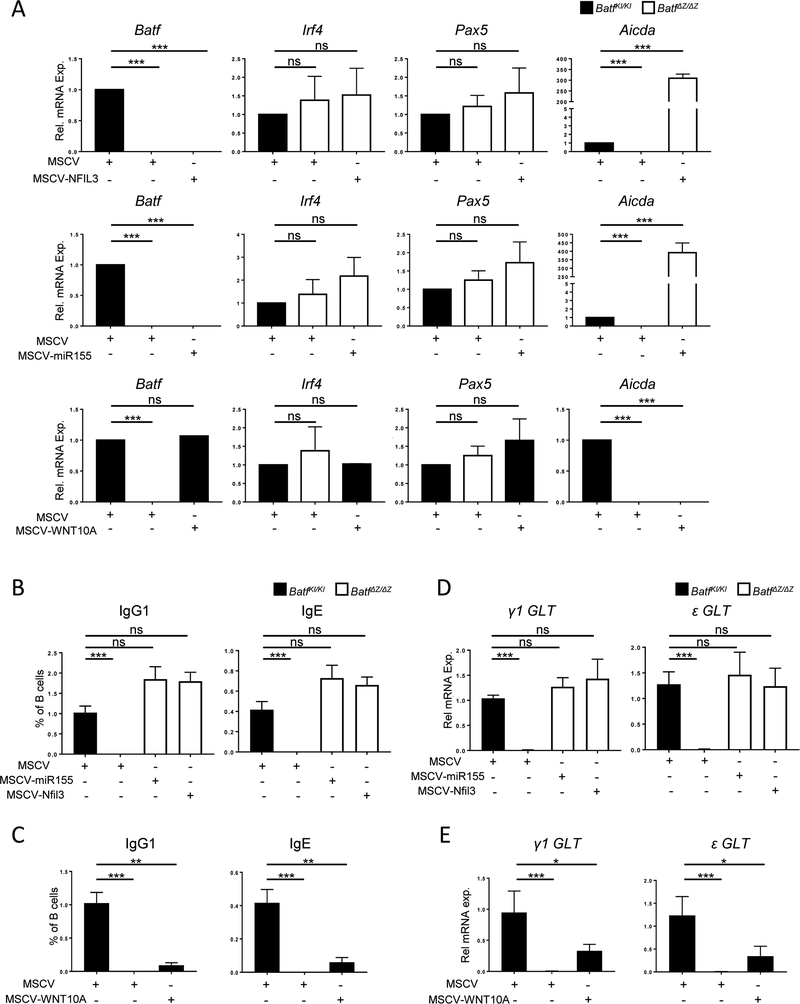
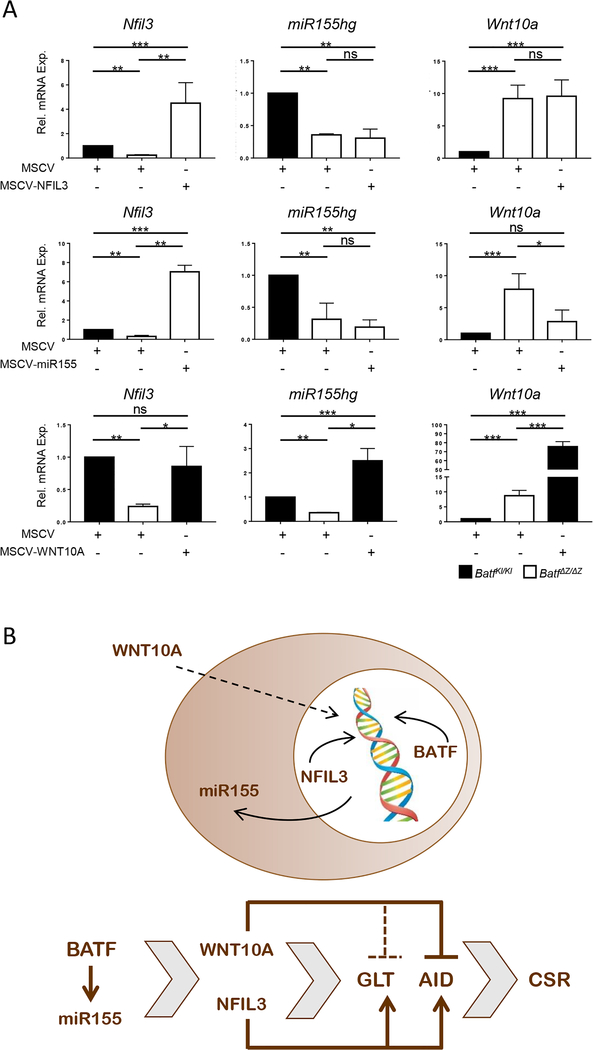
BATF functions in T cells and B cells to control the host response to antigen and promote the production of class switched immunoglobulins. In this study, we demonstrate that BATF expression increases rapidly, and transiently, following B cell stimulation and use an inducible murine model of BATF deletion to show that this induction is necessary, and sufficient, for immunoglobulin (Ig) class switch recombination (CSR). We examine two genes (Nfil3 and miR155gh) that are positively regulated, and one gene (Wnt10a) that is negatively regulated by BATF during CSR. These genes play essential roles in CSR and each impacts the expression and/or function of the others. Our observations allow these targets of BATF regulation to be positioned in a network upstream of the activation of germline transcripts (GLT) from the IgH locus and of transcriptional activation of Aicda - the gene encoding the enzyme directing Ig gene rearrangements. This work extends the knowledge of the molecular control of CSR and, importantly, positions the induction and function of BATF as an early event in this process.

Keywords: B cells; BATF; class switch recombination; signaling pathways; transcription regulation.


Conflict of interest statement

Conflict of Interest

The authors declare no commercial or financial conflict of interest.

Figures

Figure 1.
Figure 1.. BATF is required for B cells to produce IgG.
Splenic B cells, isolated from BatfKI/KI and BatfΔZ/ΔZ mice were labeled with CFSE and cultured with LPS and IL-4. CFSE dilution was analyzed by flow cytometry. The gating strategies to identify lymphocytes using (upper panel) and the percent of those cells that are proliferating (bar, middle panel) are shown. Results in the histogram (lower panel) are the mean±SEM of data collected from four independent CFSE experiments, each using cells from one mouse per genotype. SSC (side scatter); FSC (forward scatter) (B) B cells isolated from BatfKI/KI and BatfΔZ/ΔZ spleens were cultured in the presence of absence of LPS and IL-4 and protein extracts immunoblotted to visualize the indicated proteins. Signals were normalized to HSP90 and expressed relative to unstimulated BatfKI/KI B cells (set to 1.0). Shown is a representative blot from two independent experiments using protein from two mice per genotype. (C) Media from cultured BatfKI/KI and BatfΔZ/ΔZ B cells were screened by ELISA for the indicated Ig. Results shown are the mean±SEM pooled from two independent experiments, each using cells from two mice per genotype. (***p<0.0001; ns=not significant; two-tailed, unpaired Student’s t-test)
Figure 2.
Figure 2.. BATF has a biphasic expression pattern.
(A, B) RNA was prepared from WT splenic B cells at the indicated times following stimulation. RT-qPCR, performed in duplicate, was used to detect the indicated transcripts. Results were normalized to β-actin and expressed relative to time 0 (set to 1.0). Results shown are the mean±SEM of data obtained from four independent experiments, each using RNA from one mouse. (C) Protein was isolated from WT B cells at the indicated times following stimulation. Immunoblotting was used to detect the expression of proteins. Signals were normalized to HSP90 and expressed relative to time 0 (set to 1.0). Shown is a representative blot from four independent experiments, each using protein pooled from two mice.
Figure 3.
Figure 3.. Early expression of BATF is necessary and sufficient for CSR.
(A) Schematic of TAM treatment to generate the timed deletion of Batf in the Δ0 and Δ12 IzT B cell cultures. (B and D) Control (C), Δ0 and Δ12 cells were sorted and RNA analyzed by RT-qPCR for the indicated transcripts, in duplicate. Results are normalized to β-actin (B) or Gapdh (D) and expressed relative to the control (set to 1.0). Results shown are the mean±SEM of data from four independent experiments, using RNA from one mouse per treatment. (C) Δ0 and Δ12 B cells were surface stained for IgM, IgG1, and IgE and profiled by flow cytometry. Gating strategy is in Suppl. Figure 2. Results are presented as the mean±SEM of data from six independent experiments, each using cells from one mouse per treatment. (**p<0.01; ***p<0.0001; ns=not significant; two-tailed, unpaired Student’s t-test)
Figure 4.
Figure 4.. Analysis of Batf ΔZ/ΔZ B cell transcripts by RNA-Seq.
(A) Heatmap of the top 50 significantly altered genes in BatfΔZ/ΔZ B cells at 6hrs post-stimulation. (B) Shown are the top 5 GO:Biological Processes pathways into which genes identified by the RNA-Seq cluster. (C) RNA isolated from BatfKI/KI and BatfΔZ/ΔZ splenic B cells cultured in the presence or absence of LPS and IL-4 was analyzed by RT-qPCR, in duplicate, to confirm mis-expression of three putative BATF targets genes. Results were normalized to β-actin and expressed relative to unstimulated BatfKI/KI B cells (set to 1.0). Results shown are the mean±SEM of data collected from two independent experiments, each using RNA from two mice per genotype. (*p<0.05; **p<0.01; ***p<0.0001; ns=not significant; two-tailed, unpaired Student’s t-test)
Figure 5:
Figure 5:. BATF re-expression restores gene expression and CSR in BatfΔZ/ΔZ B cells.
Stimulated B cells isolated from spleens of BatfKI/KI and BatfΔZ/ΔZ mice were transduced with either MSCV or MSCV-BATF and Thy1.1 + cells isolated by FACS. (A) Protein extracts were immunoblotted, in duplicate, to detect the indicated proteins. Signals were normalized to HSP90 and expressed relative to MSCV-transduced, stimulated BatfKI/KI B cells (set to 1.0). Shown is a representative blot from three individual experiments in which protein from two BatfKI/KI or BatfΔZ/ΔΖ mice were blotted in parallel for each treatment. (B, D and E) RNA and microRNA from each group was analyzed by RT-qPCR to detect the indicated transcripts, in duplicate. Aicda, Nfil3 and Wnt10a transcripts are normalized to β-actin (B and E), miR155 to RNU6 (E) and GLT transcripts to Gapdh (D) and are expressed relative to levels in unstimulated BatfKI/KI B cells (B and E) (set to 1.0, but not shown) or MSCV-transduced BatfKI/KI B cells (set to 1.0) (D). Results shown are the mean±SEM of data collected from three independent experiments, each using RNA or microRNA from two mice per genotype and treatment. (C) Transduced cells from each group were profiled for Thy1.1 and surface IgG1 and IgE expression by flow cytometry. See Suppl. Figure 7 for gating strategy. Results shown are the mean±SEM of data collected from three independent experiments, each using cells from two mice per genotype and treatment. (F) RNA and microRNA were prepared from control (C) and TAM-treated Δ0 and Δ12 GFP+ IzT B cells (see Figure 3). RT-qPCR was used to detect the indicated RNAs, in duplicate. Results are normalized to β-actin (mRNA) or RNU6 (miRNA) and expressed relative to levels in Izt control cells (set to 1.0). Results are presented as the mean±SEM of data from four independent experiments, using RNA or microRNA isolated from one mouse per treatment. (*p<0.05; **p<0.01; ***p<0.0001; ns=not significant; two-tailed, unpaired Student’s t-test)
Figure 6:
Figure 6:. BATF binding accompanies regulation of Nfil3, miR155hg and Wnt10a expression.
Chromatin was prepared from B cells isolated from spleens of WT and BatfΔZ/ΔZ mice and stimulated with LPS and IL-4. ChIP was performed to detect binding of BATF (A) or acetylation of H3K27 (B) at the indicated AP-1 or AICE motifs identified within Nfil3, mir155gh and Wnt10a (see Suppl. Figure 5A). BATF binding to AP-1(E) of Myb was used as a positive control while non-BATF bound AP-1 (N) of Myb was used as a normalization control for background [29]. (B) DNA associated with H3K27 acetylation is expressed as a % of total input. Results shown are the mean±SEM of data obtained from two independent ChIP experiments, each performed with DNA isolated from two mice per genotype and time point. (**p<0.01; ***p<0.0001; ns=not significant; two-tailed, unpaired Student’s t-test)
Figure 7:
Figure 7:. NFIL3, miR155 and WNT10A impact Aicda expression and CSR.
Stimulated B cells isolated from spleens of BatfKI/KI and BatfΔZ/ΔZ mice were transduced with the indicated retroviruses. Transduced, Thy1.1 cells isolated by FACS. (A, D and E) RNA from each group was analyzed by RT-qPCR to detect the indicated transcripts, in duplicate. Results are normalized to β-actin (A) or Gapdh (D and E) and are expressed relative to levels in MSCV-transduced, BatfKI/KI B cells (set to 1.0). Results are presented as the mean±SEM of data collected from three independent experiments, each using RNA from two mice per genotype. (B and C) Transduced cells from each group were profiled for Thy1.1 and surface IgG1 and IgE expression by flow cytometry. Gating strategy is in Suppl. Figure 7. Results shown are the mean±SEM of data obtained from six independent experiments, each using cells from one mouse per treatment. (*p<0.05; **p<0.01; ***p<0.0001; ns=not significant; two-tailed, unpaired Student’s t-test)
Figure 8:
Figure 8:. Hierarchy of BATF, NFIL3, miR155 and WNT10A in regulating CSR.
(A) Stimulated B cells from BatfKI/KI and BatfΔZ/ΔZ spleens were transduced with the indicated retroviruses and Thy1.1 cells isolated by FACS. RNA from each group was analyzed by RT-qPCR to detect the indicated transcripts, in duplicate. Results are normalized to β-actin and expressed relative to the level in MSCV-transduced BatfKI/KI B cells (set to 1.0). Results shown are the mean±SEM of data collected from three independent experiments, each with RNA from two mice per genotype. (*p<0.05; **p<0.01; ***p<0.0001; ns=not significant; two-tailed, unpaired Student’s t-test) (B) Working model depicting the primary site of action of the molecules examined in this study (upper) and the hierarchy of their actions in inducing IgH GLT, AID expression and CSR in B cells (lower).

References

    1. Murphy TL, Tussiwand R, Murphy KM. Specificity through cooperation: BATF-IRF interactions control immune-regulatory networks. Nat. Rev. Immunol. 2013; 13:499–509. - PubMed
    1. Sopel N, Graser A, Mousset S, Finotto S. The transcription factor BATF modulates cytokine-mediated responses in T cells. Cytokine Growth Factor Rev. 2016; 30:39–45. - PubMed
    1. Dorsey M, Tae H, Sollenberger K, Mascarenhas N, Johansen L, Taparowsky E. B-ATF: a novel human bZIP protein that associates with members of the AP-1 transcription factor family. Oncogene 1995; 11:2255–2265. - PubMed
    1. Wang H, Xie Z, Scott RE. Differentiation modulates the balance of positive and negative Jun AP-1 DNA binding activities to regulate cellular proliferative potential: different effects in nontransformed and transformed cells. J. Cell Biol. 1996; 135:1151–1162. - PMC - PubMed
    1. Kuwahara M, Ise W, Ochi M, Suzuki J, Kometani K, Maruyama S, et al. Bach2-BATF interactions control Th2-type immune response by regulating the IL-4 amplification loop. Nat. Commun. 2016; 7:1–13. - PMC - PubMed

Publication types

MeSH terms