. 2018 Jun 12;23(11):3262-3274.
doi: 10.1016/j.celrep.2018.05.050.

Targeting EZH2 Reprograms Intratumoral Regulatory T Cells to Enhance Cancer Immunity

Affiliations

Targeting EZH2 Reprograms Intratumoral Regulatory T Cells to Enhance Cancer Immunity

David Wang et al. Cell Rep. .

Abstract

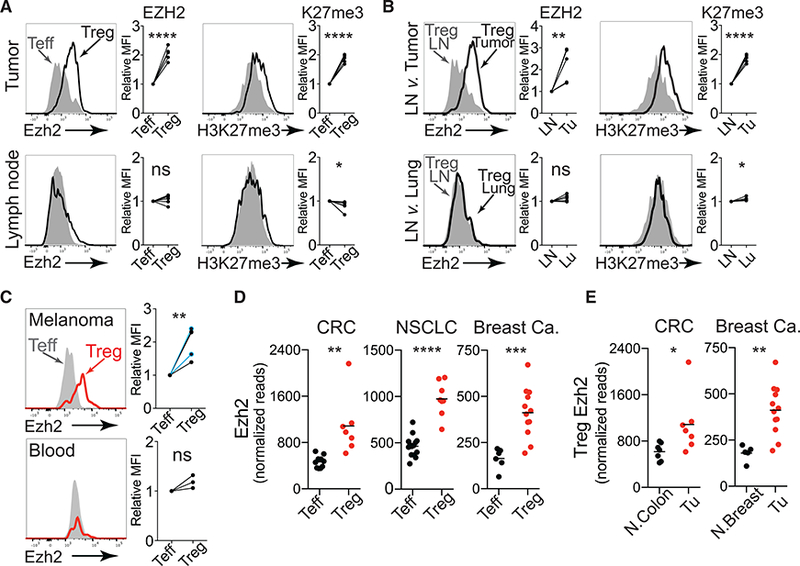
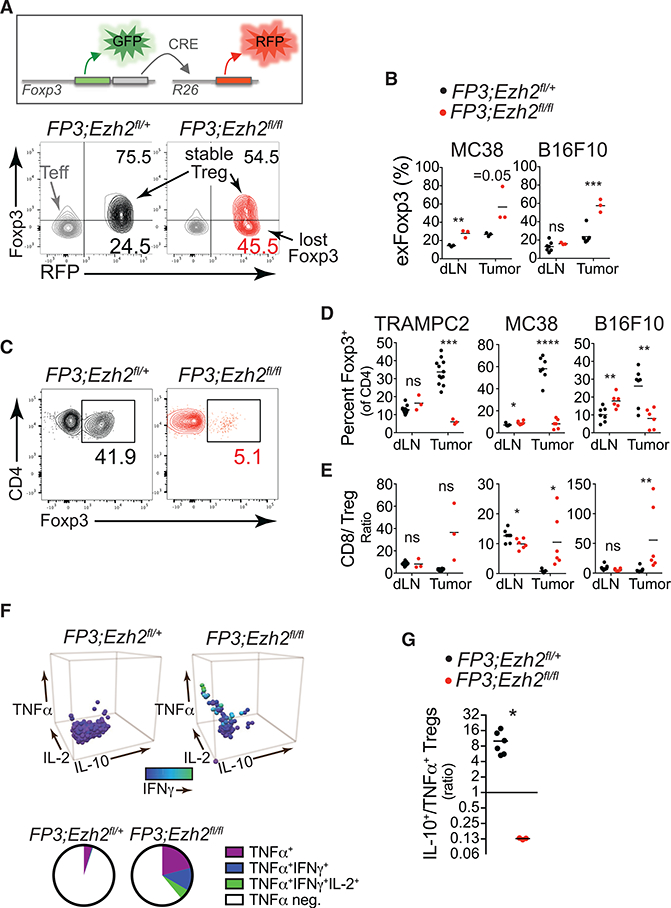
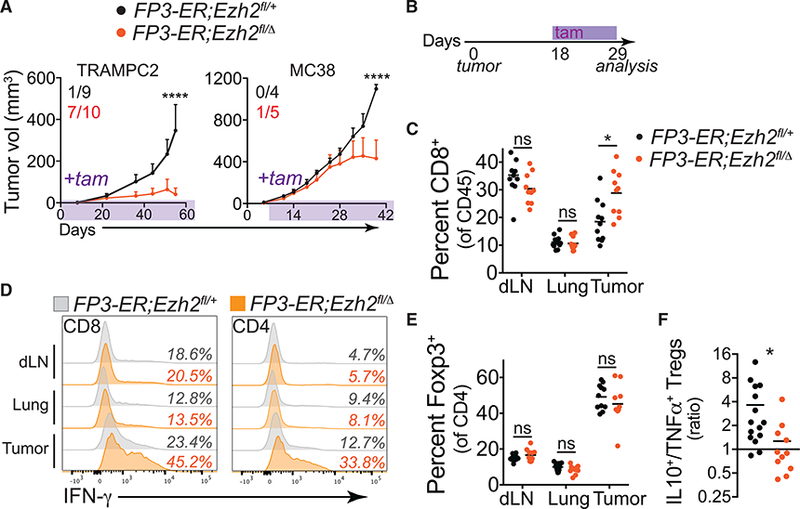
Regulatory T cells (Tregs) are critical for maintaining immune homeostasis, but their presence in tumor tissues impairs anti-tumor immunity and portends poor prognoses in cancer patients. Here, we reveal a mechanism to selectively target and reprogram the function of tumor-infiltrating Tregs (TI-Tregs) by exploiting their dependency on the histone H3K27 methyltransferase enhancer of zeste homolog 2 (EZH2) in tumors. Disruption of EZH2 activity in Tregs, either pharmacologically or genetically, drove the acquisition of pro-inflammatory functions in TI-Tregs, remodeling the tumor microenvironment and enhancing the recruitment and function of CD8+ and CD4+ effector T cells that eliminate tumors. Moreover, abolishing EZH2 function in Tregs was mechanistically distinct from, more potent than, and less toxic than a generalized Treg depletion approach. This study reveals a strategy to target Tregs in cancer that mitigates autoimmunity by reprogramming their function in tumors to enhance anti-cancer immunity.


Conflict of interest statement

DECLARATION OF INTERESTS

The authors declare no competing interests.

Figures

Figure 1.
Figure 1.. EZH2 Inhibition Disrupts Tumor Progression via a T Cell-Dependent Mechanism
(A and B) Growth curve of MC38 tumors in untreated or EZH2 inhibitor-treated Rag-1−/− mice (A) or C57BL/6 mice (B) beginning 1 day after tumor inoculation throughout the experiment. Inset numbers represent the number of mice that rejected tumors of total implanted. (C) Percentage of CD8+ T cells of viable CD45+ immune cells in MC38 tumors in (B) by flow cytometric analysis. (D) Mean fluorescent intensity (MFI) of antibody staining for H3K27me3 and EZH2 in Tregs from untreated or EZH2 inhibitor-treated mice from (B). (E and F) Percentage of FOXP3+ Treg cells of CD4+ T cells (E) and ratio of CD8+ T cell to FOXP3+ Tregs (F) in tumors from (B). (G) MFI of antibody staining for FOXP3 in Tregs from untreated or EZH2 inhibitor-treated mice from (B). Data represent means ± SEMs; *p < 0.05, **p < 0.01, ***p < 0.001, and ****p < 0.0001 from two-way ANOVA with Sidak’s multiple comparisons or by unpaired t tests. See also Figure S1.
Figure 2.
Figure 2.. Elevated Expression of EZH2 in Tumor-Infiltrating Tregs
(A) Flow cytometric staining for EZH2 and H3K27me3 levels in Teff (filled histogram) and Treg (solid black line) cells isolated from mouse MC38 tumors (top) and tumor draining lymph nodes (bottom). Quantification of data from two independent experiments with two to three mice per group is shown with Treg MFI relative to Teff MFI. (B) Flow cytometric staining for EZH2 and H3K27me3 levels in Tregs isolated from draining lymph node (filled histograms) versus Tregs from MC38 tumors (top) or lung (bottom) (black lines). Data quantified as in (A). (C) Flow cytometric staining for EZH2 levels in Teff (filled histogram) versus Treg (solid red line) cells isolated from human melanoma and blood. Relative expression of EZH2 in Treg compared to Teff in all melanomas examined (n = 5, shown below). Two patients were treated with pembroluzimab (blue). Data quantified as in (A). (D) Normalized read counts of Ezh2 from RNA sequencing of Teff and Treg cells isolated from primary human colorectal carcinoma (CRC), non-small-cell lung cancer (NSCLC), and breast cancer. (E) Normalized read counts of Ezh2 from RNA sequencing of Treg cells isolated from tumors of patients with CRC and patients with breast cancer versus adjacent normal tissue. Data represent means ± SEMs; *p < 0.05, **p < 0.01, ***p < 0.001, and ****p < 0.0001 from unpaired t tests. See also Figure S1.
Figure 3.
Figure 3.. EZH2 Function in TI-Tregs Is Required to Block Anti-tumor T Cell Responses
(A-C) Growth curves of multiple syngeneic tumor models—MC38 (A), TRAMPC2 (B), and B16F10 (C) — in mice with constitutive deletion of Ezh2 in Tregs (FP3;Ezh2fl,fl) compared with littermate controls (FP3;Ezh2fl/+, Ezh2fl,[fl,+]). B16GVAX was administered 2 days before B16 tumor inoculation. (D) Growth curves of MC38 tumors in mice with constitutive deletion of Jmjd3 in Tregs (FP3;Jmjd3fl/fl) compared with littermate controls (FP3;Jmjd3fl/l,+). Inset numbers represent the number of mice that rejected tumors of total implanted pooled from all of the experiments. Data represent means ± SEMs; *p < 0.05, **p < 0.01, ***p < 0.001, and ****p < 0.0001 from two-way ANOVA with Sidak’s multiple comparisons. See also Figure S2.
Figure 4.
Figure 4.. Enhanced Number and Function of Tumor-Infiltrating T Cells with EZH2 Disruption in Tregs
(A and B) Multiplexed immunohistochemical staining for CD8 (teal), CD4 (yellow), and Foxp3 (dark brown nuclear stain) in MC38 tumors from control (A) or FP3;Ezh2fl/fl mice (B). Scale bars, 200 μm and 50 μm (inset). (C and D) Percentage of CD8+ (C) or effector CD4+ T cells (eCD4+: CD4+Foxp3) (D) of viable CD45+ immune cells in tumor draining lymph node (dLN) or tumor by flow cytometric analysis. (E) Representative flow cytometry of IFN-γ and TNF-α produced in stimulated CD8+ T cells from tumors in control or FP3;Ezh2fl/fl mice and quantification of results from one of two experiments. (F) Representative flow cytometry of IFN-γ and IL-2 produced in stimulated eCD4+ T cells from tumors in control or FP3;Ezh2fl/fl mice and quantification of results from one of two experiments. (G) Pie chart depicting the fraction of CD8+ and eCD4+ T cells that produce multiple cytokines from control or FP3;Ezh2fl/fl mice in (E) and (F). Asterisks indicating significance determined by unpaired t tests between groups are *p < 0.05, **p < 0.01, ***p < 0.001, and ****p < 0.0001. Data represent means ± SEMs pooled from two or more experiments; *p < 0.05, **p < 0.01, ***p < 0.001, and ****p < 0.0001 from unpaired t tests. See also Figure S2.
Figure 5.
Figure 5.. Foxp3 Instability and Altered Function of Ezh2-Deficient Tregs within the Tumor Microenvironment
(A) Foxp3 lineage tracing by flow cytometric analysis of the frequency of Tregs that lost Foxp3 expression (exFoxp3 cells = GFP_RFP+) compared to stable Tregs (GFP+RFP+) in an MC38 tumor from control or FP3;Ezh2fl/fl mice. Effector CD4+Foxp3– T cells (Teff; CD4+Foxp3_RFP_) are shown in gray for reference. (B) Quantification of exFoxp3 cells in dLN and tumorsfrom MC38 and B16F10 tumor-bearing mice. (C) Flow cytometric analysis of the percentage of FOXP3+ Treg cells of CD4+ T cells in an MC38 tumor from control or FP3;Ezh2fl/fl mice. (D and E) Quantification of the percentages of FOXP3+ Treg cells of CD4+ T cells (D) or the ratio of CD8+ T cells to FOXP3+ Tregs (E) in dLN and tumor from control or FP3;Ezh2fl/fl mice. (F) Intracellular cytokine staining for IL-10, TNF-a, IL-2, and IFN-g in FOXP3+ Treg cells isolated from MC38 tumors of FP3;Ezh2fl/+ and FP3;Ezh2fl/fl mice. IFN-g staining is indicated by shading. Pie chart depicts the fraction of Tregs producing multiple cytokines shown below. Representative data from three mice per group and two experiments. (G) Ratio of IL-10+ Tregs to TNF-a+ Tregs isolated from MC38 tumors in control versus FP3;Ezh2fl/fl mice. Data represent means ± SEMs pooled from two or more experiments; *p < 0.05, **p < 0.01, ***p < 0.001, and ****p < 0.0001 from unpaired t tests. See also Figure S3.
Figure 6.
Figure 6.. Temporal Disruption of EZH2 Function in Tregs Promotes Anti-tumor Immunity
(A) TRAMPC2 and MC38 tumor growth in FP3-ER;Ezh2fl/+ or FP3-ER;Ezh2fl/Δ mice treated with tam (timing indicated by shading). Inset numbers represent the number of mice that rejected tumors of total implanted. (B) Timeline for short-term tam administration (11 days) to FP3-ER MC38 tumor-bearing animals in (C), (D), and (E). (C) Percentage of CD8+ T cells of CD45+ immune cells in draining lymph node (dLN), lung, and MC38 tumor tissues. (D) Representative intracellular cytokine staining for IFN-γ in CD8+ and effector CD4+ T cells in control (gray histograms) or FP3-ER;Ezh2fl/Δ mice (orange histograms). Quantification of data in Figures S5D and S5E. (E) Percentage of FOXP3+ Tregs of CD4+ T cells. (F) Ratio of IL-10+ FOXP3+ Tregs to TNF-α+ FOXP3+ Tregs isolated from MC38 tumors in tam-treated FP3-ER;Ezh2fl/+ versus FP3-ER;Ezh2fl/Δ mice. Data represent means ± SEMs from two or more experiments; *p < 0.05, **p < 0.01, ***p < 0.001, and ****p < 0.0001 from two-way ANOVA with Sidak’s multiple comparisons or by unpaired t tests. See also Figures S4 and S5.
Figure 7.
Figure 7.. The Presence of Ezh2-Deficient Tregs Are Required to Promote Tumor Rejection
(A) Timeline for diphtheria toxin (DT) administration to FP3-DTR mice or tam administration to FP3-ER mice bearing MC38 tumors in (B), (C), and (D). (B) Percentage of FOXP3+ Tregs of CD4+ T cells in lymph nodes. (C) Representative pictures of mice temporally disrupted for EZH2 in Tregs (left) or depleted of Tregs (right). (D) Absolute number of CD8+ T cells (top) and effector CD4+ T cells (eCD4+: CD4+Foxp3, bottom) in tumor, lung, and draining lymph node (dLN) of indicated mice. (E) TRAMPC2 and MC38 tumor growth in FP3-DTR micewith orwithout DT treatment (time ofadministration indicated by shading). Inset numbers represent the number of mice that rejected tumors of total implanted. (F) Scheme (top) and representative flow cytometry plot (bottom) illustrating chimeric female model fortransiently eliminating wild-typeTregs in the presence of Ezh2-deficient Tregs. (G) MC38 tumor growth in indicated chimeric female mice treated with diphtheria toxin from tumor inoculation throughout. (H) MC38 tumor growth in indicated chimeric female mice or FP3-DTR/FP3-DTR mice treated short term with diphtheria toxin from days—2 to 4 after tumor inoculation. Inset numbers represent the number of mice that rejected tumors of total inoculated in one of two experiments(see Figure S6 for cumulative results). p values indicate comparison between red (Ezh2fl/fl) and blue (FP3-DTR) lines, but comparison of red to black (Ezh2fl/+) lines at these three time points also was significant. No significant difference at any time point observed between black and blue lines. Data represent means ± SEMs from two or more experiments; *p < 0.05, **p < 0.01, ***p < 0.001, and ****p < 0.0001 from two-way ANOVA with Sidak’s multiple comparisons or by unpaired t tests. See also Figure S6.

References

    1. Arvey A, van der Veeken J, Samstein RM, Feng Y, Stamatoyannopoulos JA, and Rudensky AY (2014). Inflammation-induced repression of chromatin bound bythetranscriptionfactorFoxp3 in regulatoryTcells. Nat. Immunol 15, 580–587. - PMC - PubMed
    1. Bailey-Bucktrout SL, Martinez-Llordella M, Zhou X, Anthony B, Rosenthal W, Luche H, Fehling HJ, and Bluestone JA (2013). Self-antigen-driven activation induces instability of regulatoryT cellsduring an inflammatory autoimmune response. Immunity 39, 949–962. - PMC - PubMed
    1. Bos PD, Plitas G, Rudra D, Lee SY, and Rudensky AY (2013). Transient regulatoryT cell ablation deters oncogene-driven breast cancerand enhances radiotherapy. J. Exp. Med 210, 2435–2466. - PMC - PubMed
    1. Chen A, Liu S, Park D, Kang Y, and Zheng G (2007). Depleting intratumoral CD4+CD25+ regulatory T cells via FasL protein transfer enhances the therapeutic efficacy of adoptive T cell transfer. Cancer Res. 67, 1291–1298. - PubMed
    1. Curiel TJ (2007). Tregs and rethinking cancer immunotherapy. J. Clin. Invest 117, 1167–1174. - PMC - PubMed

Publication types

MeSH terms

Substances