. 2018 Jun 12;23(11):3286-3299.
doi: 10.1016/j.celrep.2018.05.032.

Autophagy Differentially Regulates Insulin Production and Insulin Sensitivity

Affiliations

Autophagy Differentially Regulates Insulin Production and Insulin Sensitivity

Soh Yamamoto et al. Cell Rep. .

Abstract

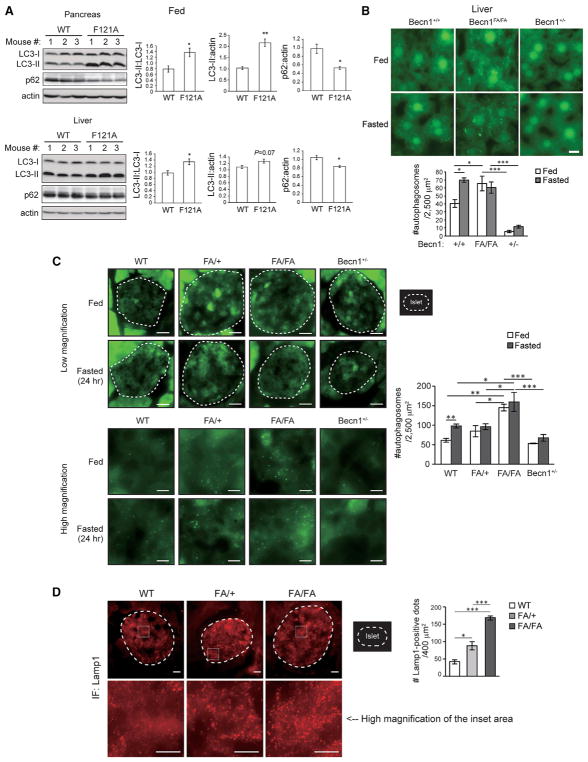
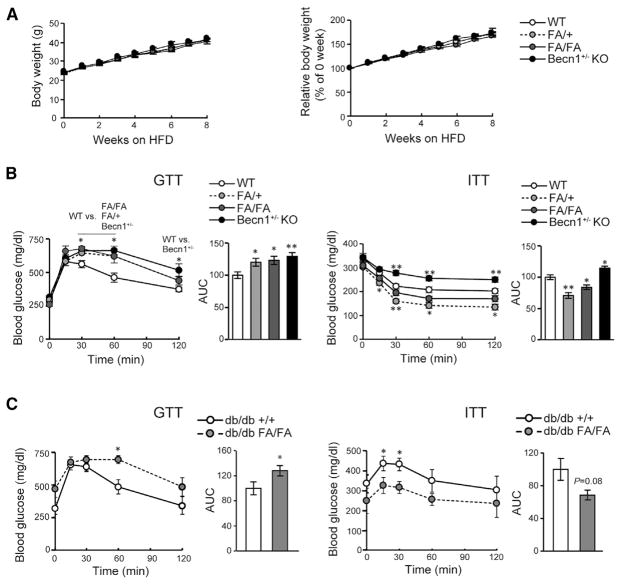
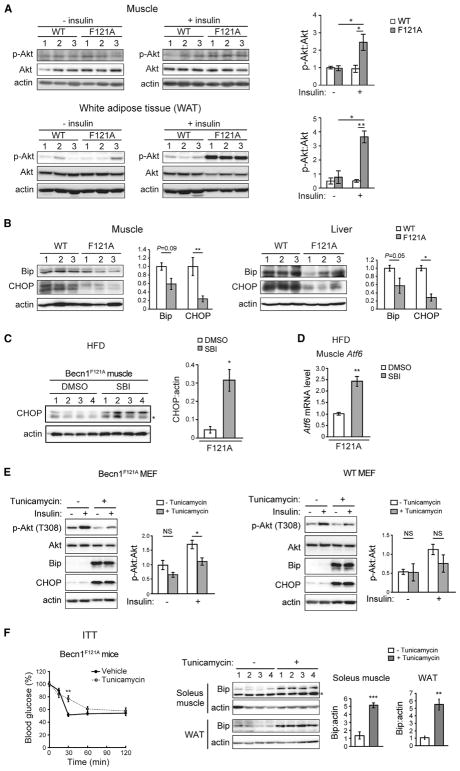
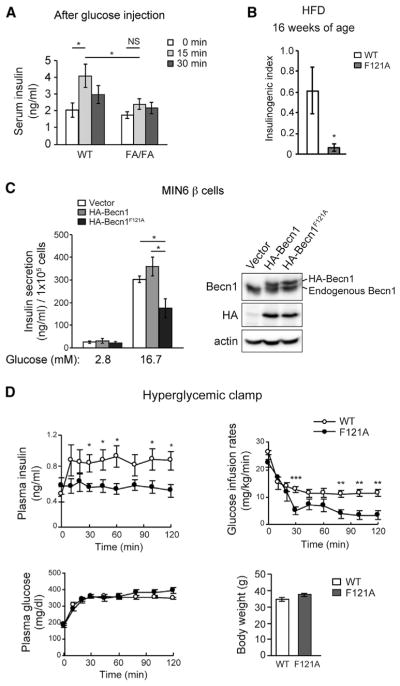
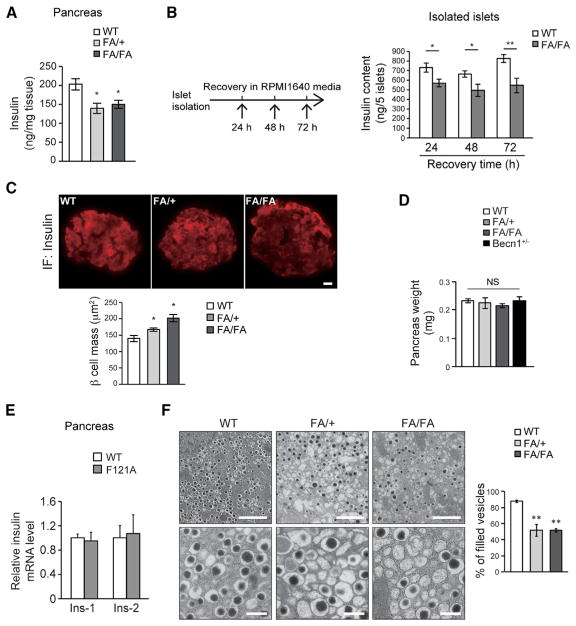
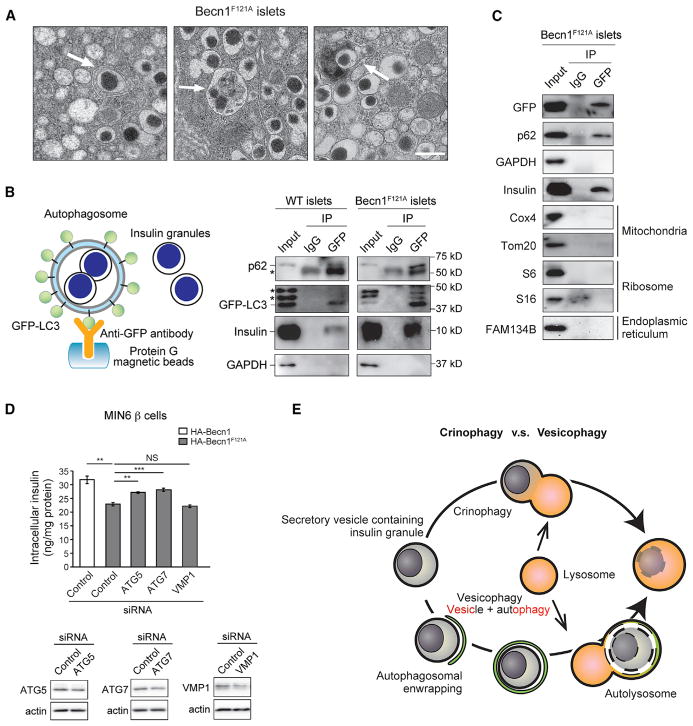
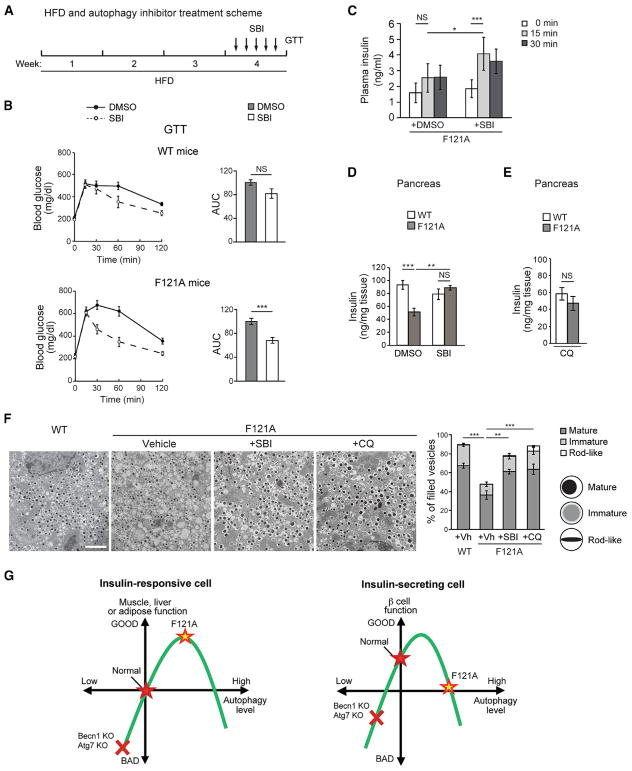
Autophagy, a stress-induced lysosomal degradative pathway, has been assumed to exert similar metabolic effects in different organs. Here, we establish a model where autophagy plays different roles in insulin-producing β cells versus insulin-responsive cells, utilizing knockin (Becn1F121A) mice manifesting constitutively active autophagy. With a high-fat-diet challenge, the autophagy-hyperactive mice unexpectedly show impaired glucose tolerance, but improved insulin sensitivity, compared to mice with normal autophagy. Autophagy hyperactivation enhances insulin signaling, via suppressing ER stress in insulin-responsive cells, but decreases insulin secretion by selectively sequestrating and degrading insulin granule vesicles in β cells, a process we term "vesicophagy." The reduction in insulin storage, insulin secretion, and glucose tolerance is reversed by transient treatment of autophagy inhibitors. Thus, β cells and insulin-responsive tissues require different autophagy levels for optimal function. To improve insulin sensitivity without hampering secretion, acute or intermittent, rather than chronic, activation of autophagy should be considered in diabetic therapy development.

Keywords: Becn1; autophagosome; autophagy; glucose tolerance; insulin granule; insulin sensitivity; insulin-responsive tissue; type 2 diabetes; vesicophagy; β cell.


Conflict of interest statement

DECLARATION OF INTERESTS

The authors declare no competing interests.

Figures

Figure 1
Figure 1. Becn1F121A Knockin Mice Demonstrate Systemic High Autophagy in Metabolic Tissues at Non-autophagy-Inducing Conditions
(A) Western blot analysis (left) and quantification (right) of autophagy in pancreas (upper) and liver (lower) of WT and Becn1F121A mice under the fed condition. n = 3; t test. (B) Fluorescence images (upper panels) and quantification (lower panels) of GFP-LC3 puncta (autophagosomes) in the liver of Becn1+/+, Becn1FA/FA, or Becn1+/− KO mice expressing the GFP-LC3 transgene under fed conditions or subject to 24-hr fasting. FA, F121A. Scale bar, 10 μm. One-way ANOVA. n = 3. (C) Fluorescence images (left: upper panels, low magnification; lower panels, high magnification) and quantification (right) of GFP-LC3 puncta (autophagosomes) in islets of Becn1+/+ (WT), Becn1FA/+ (FA/+), Becn1FA/FA (FA/FA), or Becn1+/− KO mice expressing the GFP-LC3 transgene under fed conditions or subject to 48-hr starvation. Dashed lines indicate the area of islets, which were detected by anti-insulin staining. FA, Becn1F121A. Scale bars, 40 μm in the upper panels and 10 μm in the lower panels. n = 3 mice. The value of each mouse is an average of 8–11 islets per mouse. One-way ANOVA with Tukey-Kramer test. (D) Immunofluorescence images (left) and quantification (right) of Lamp-1 positive lysosomes or autolysosomes in islets of WT, FA/+, and FA/FA mice. Islets were detected by immunostaining with an anti-glucagon antibody. Scale bars, 20 μm in the upper panel and 10 μm in the lower panel, respectively. n = 3–5 mice. The value of each mouse is an average of 5 islets per mouse. One-way ANOVA with Tukey-Kramer test. Results represent mean ± SEM. *p < 0.05; **p < 0.01; ***p < 0.001. See also Figures S1 and S4.
Figure 2
Figure 2. Autophagy-HyperactiveBecn1F121A Mice Are Less Glucose Tolerant, but More Insulin Sensitive, in Response to HFD
(A) Body weight gain (in grams in the left panel and percent in the right panel) of Becn1+/+ (WT), Becn1FA/+ (FA/+), Becn1FA/FA (FA/FA), and Becn1+/− KO mice fed with an HFD for 8 weeks starting at 8 weeks old. WT, n = 34; FA/+, n = 17; FA/FA, n = 22; Becn1+/−, n = 15. (B) Glucose tolerance test (GTT, left) and insulin tolerance test (ITT, right) of Becn1+/+ (WT), Becn1FA/+ (FA/+), Becn1FA/FA (FA/FA), and Becn1 KO mice fed with an HFD for 8 weeks. Statistics are compared with those for WT; one-way ANOVA with Dunnett’s test. n = 6–12. AUC, area under the curve. (C) GTT (left) and ITT (right) in db/db mice expressing WT Becn1 (+/+) or Becn1F121A (FA/FA) treated with HFD. GTT was performed after 4 weeks of HFD feeding, and ITT was performed after 6 weeks of HFD feeding. Statistics are compared with those for db/db +/+ mice. n = 8; t test. Results represent mean ± SEM. *p < 0.05; **p < 0.01. See also Figures S2, S3, and S4.
Figure 3
Figure 3. Reduction in HFD-Induced ER Stress in Becn1F121A Mice Mediates Higher Insulin Sensitivity in Insulin-Responsive Tissues
(A) Western blot analyses (left) and quantification (right) of insulin-induced Akt T308 phosphorylation in muscle (upper panels) and white adipose tissue (lower panels) of WT and Becn1F121A mice fed with an 8-week HFD. The tissues were collected 10 min after injection i.p. of 2 U/kg insulin. n = 3; one-way ANOVA with Tukey-Kramer test. (B) Reduced HFD-induced ER stress in insulin-responsive tissues of Becn1F121A mice. Western blot analyses and quantification of the ER stress markers Bip and CHOP in skeletal muscle (left) and liver (right) of WT or Becn1F121A mice treated with HFD for 8 weeks. n = 3; t test. (C and D) Western blot analysis and quantification of CHOP (C) and qPCR analysis of Atf6 (D) in skeletal muscle of Becn1F121A mice treated with HFD for 8 weeks and subject to 10 injections of the autophagy inhibitor SBI-0206965 (SBI) or vehicle (DMSO) once daily during the last 2 weeks of HFD feeding. The asterisk indicates a nonspecific band. n = 4; t test. (E) Western blot analysis and quantification of insulin-stimulated phosphorylation of Akt T308 in WT (right) or Becn1F121A (left) primary MEFs treated with vehicle or tunicamycin at 0.01 μg/ml for 16 h. Samples were collected 10 min after insulin treatment. N = 4. t test. (F) ITT of 8-week HFD-fed Becn1F121A mice subject to one injection of vehicle or the ER stressor tunicamycin at 1 μg/kg for 24 hr. Percentage of blood glucose at the basal level (time 0) during ITT is indicated. n = 5. Western blot analysis and quantification of the ER stress marker Bip in skeletal muscle (soleus) and white adipose tissue (WAT) from the mice are indicated on the left; t test. Results represent mean ± SEM. *p < 0.05; **p < 0.01; ***p < 0.001; NS, not significant. See also Figures S5, S6, and S7.
Figure 4
Figure 4. The Autophagy-Hyperactive Becn1F121A Mutation Reduces GSIS
(A) ELISA analyses of plasma insulin levels 0–30 min after glucose injection in HFD-fed WT and Becn1F121A mice. n = 6–7; one-way ANOVA with Tukey-Kramer test. (B) Insulinogenic index of WT and Becn1F121A mice fed with HFD for 8 weeks. n = 6. (C) GSIS in MIN6 β cells stably expressing vector, or hemagglutinin (HA)-tagged WT Becn1 or Becn1F121A mediated by lentivirus, normalized to cell number. Western blot analysis of Becn1 expression in MIN6 cells was shown on the right. n = 5; t test. (D) Hyperglycemic clamp study of WT and Becn1F121A mice fed with HFD for 9 weeks. Plasma insulin, glucose infusion rate, plasma glucose, and body weight are shown. n = 9–10; t test. Data represent mean ± SEM. *p < 0.05; **p < 0.01; ***p < 0.001. See also Figure S7.
Figure 5
Figure 5. Autophagy-HyperactiveBecn1F121A Mice Have Reduced Pancreatic Insulin Storage in Response to HFD, Despite No Reduction in β Cell or Pancreas Mass
(A) ELISA analyses of insulin levels in pancreas of HFD-fed WT, FA/+, and FA/FA mice. n = 3–6; one-way ANOVA with Tukey-Kramer test. (B) ELISA analyses of insulin contents in 5 islets isolated from HFD-fed WT and Becn1F121A mice, in a time course of 24- to 72-hr recovery in RPMI 1640 media after islet isolation. n = 6–10; t test. (C and D) Immunofluorescence images (top) and quantification (bottom) of β cell mass (insulin-positive area) (C) and quantification of whole pancreas weight (D) in Becn1+/+ (WT), Becn1FA/+ (FA/+), and Becn1FA/FA (FA/FA) mice using anti-insulin antibody. Scale bar, 20 μm. *p < 0.05; NS, not significant; compared with WT. n = 4–6. (E) Real-time PCR analyses of both insulin genes, Ins-1 and Ins-2, in islets of WT or Becn1F121A mice reveal that insulin mRNA transcription is not affected by autophagy activation. n = 3–6. (F) EM images (left) and quantification (right) of insulin granules in islets of WT, FA/+, and FA/FA mice fed with an HFD for 8 weeks. Scale bars, 2 μm in the upper panels and 500 nm in the lower panels. Statistics are compared with WT. n = 3 mice. The value of each mouse is an average of 5 islet areas per mouse; one-way ANOVA with Dunnett’s test. Data represent mean ± SEM. *p < 0.05; **p < 0.01. See also Figure S7.
Figure 6
Figure 6. Selective Autophagosomal Sequestration of Insulin Granules in the Islets of Autophagy-Hyperactive Becn1F121A Mice
(A) EM analysis of insulin granules enwrapped and degraded in autophagosomes or autolysosomes (indicated by arrows) in islets of Becn1F121A mice. Scale bar, 500 nm. (B) Autophagosomal sequestration of insulin granules is induced in islets of Becn1F121A mice. (Left) Scheme of autophagosome immunoprecipitation by anti-GFP antibody from isolated islets of mice expressing the autophagosome marker GFP-LC3. (Right) Western blot detection of insulin inside isolated autophagosomes from WT or Becn1F121A islets. A known autophagy cargo p62 serves as a positive control. Asterisks indicate nonspecific bands. (C) Western blot detection of cargos of multiple known selective autophagy pathways, including mitophagy (Tom20 and Cox4), ERphagy (Fam134b), and ribophagy (ribosome proteins S6 and S16), in isolated islets from GFP-LC3 Becn1F121A mice. (D) ELISA analyses of insulin contents in MIN6 cells stably expressing Becn1WT or Becn1F121A transfected with control siRNA or siRNA against Atg5, Atg7, or Vmp1. siRNA knockdown efficiency of Atg5, Atg7, and Vmp1 in MIN6 β cells was shown below. n = 4; t test. Data represent mean ± SEM. **p < 0.01; ***p < 0.001; NS, not significant. (E) Schematic representation of crinophagy versus vesicophagy. Crinophagy refers to the direct fusion of hormone-containing vesicles with lysosomes, whereas vesicophagy is the autophagosomal sequestration of secretory vesicles containing any secreted granules (not limited to hormones) and the subsequent delivery to lysosomes for degradation.
Figure 7
Figure 7. Transient Inhibition of Autophagy Rescues Glucose Intolerance, Insulin Secretion, and Insulin Storage in HFD-fed Becn1F121A Mice
(A) Experimental scheme of the rescue experiment. Briefly, mice were treated with HFD for 4 weeks and subject to 5 injections of the autophagy inhibitor SBI-0206965 (SBI) or vehicle (DMSO) once daily in the final week, prior to GTT. (B) Short-term autophagy inhibitor treatment improves glucose tolerance in autophagy-hyperactive mice. GTT of WT (upper panels) or Becn1F121A (lower panels) mice treated with HFD and SBI-0206965 (SBI) or vehicle (DMSO) as in (A). AUC, area under the curve. n = 6–12; t test. ***p < 0.001; t test. (C) ELISA analyses of plasma insulin levels at 0 min, 15 min, and 30 min after glucose injection in WT or Becn1F121A mice treated with HFD and SBI-0206965 (SBI) or vehicle (DMSO) once per day for 5 days. n = 10–13; one-way ANOVA. (D) ELISA analyses of insulin levels in pancreas of WT or Becn1F121A mice treated with HFD and vehicle (DMSO) or SBI-0206965 (SBI) once per day for 5 days. n = 5–9; one-way ANOVA. (E) ELISA analyses of insulin levels in pancreas of WT or Becn1F121A mice treated with HFD and chloroquine (CQ) once per day for 5 days. n = 5–8; one-way ANOVA. (F) Representative EM images (left) and quantification (right) of insulin granules in islets of HFD-fed WT or Becn1F121A mice treated with vehicle, SBI-0206965 (SBI), or chloroquine (CQ) once per day for 5 days. The number of mature, immature, and rod-like insulin granule vesicles was categorized. Scale bar, 2 μm. n = 3; one-way ANOVA. Data represent mean ± SEM. *p < 0.05; **p < 0.01; ***p < 0.001; NS, not significant. (G) Two different rheostat models of autophagy in insulin-producing β cells versus insulin-responsive tissues (such as muscle, liver, and adipose tissue). In insulin-responsive metabolic organs, relatively higher autophagy caused by Becn1F121A gain of function (yellow star) is beneficial for insulin sensitivity, yet excessive autophagy may cause cell death or malfunction. In comparison, in β cells the curve is shifted to the left due to their unique insulin-secretory function, which is also regulated by autophagy. In either tissue, autophagy deficiency caused by deletion of autophagy genes (Becn1 or Atg7, red cross) impairs the physiological function.

Comment in

References

    1. Andersson A, Olsson S, Tjälve H. Chloroquine inhibits the insulin production of isolated pancreatic islets. Biochem Pharmacol. 1980;29:1729–1735. - PubMed
    1. Chatterjee AK, Schatz H. Effect of chloroquine on biosynthesis, release and degradation of insulin in isolated islets of rat pancreas. Diabetes Res Clin Pract. 1988;5:9–15. - PubMed
    1. Chen H, Charlat O, Tartaglia LA, Woolf EA, Weng X, Ellis SJ, Lakey ND, Culpepper J, Moore KJ, Breitbart RE, et al. Evidence that the diabetes gene encodes the leptin receptor: identification of a mutation in the leptin receptor gene in db/db mice. Cell. 1996;84:491–495. - PubMed
    1. Ebato C, Uchida T, Arakawa M, Komatsu M, Ueno T, Komiya K, Azuma K, Hirose T, Tanaka K, Kominami E, et al. Autophagy is important in islet homeostasis and compensatory increase of beta cell mass in response to high-fat diet. Cell Metab. 2008;8:325–332. - PubMed
    1. Egan DF, Chun MG, Vamos M, Zou H, Rong J, Miller CJ, Lou HJ, Raveendra-Panickar D, Yang CC, Sheffler DJ, et al. Small molecule inhibition of the autophagy kinase ULK1 and identification of ULK1 substrates. Mol Cell. 2015;59:285–297. - PMC - PubMed

Publication types

MeSH terms

LinkOut - more resources