. 2018 Jun 12;23(11):3300-3311.
doi: 10.1016/j.celrep.2018.05.035.

CPT1a-Dependent Long-Chain Fatty Acid Oxidation Contributes to Maintaining Glucagon Secretion from Pancreatic Islets

Affiliations

CPT1a-Dependent Long-Chain Fatty Acid Oxidation Contributes to Maintaining Glucagon Secretion from Pancreatic Islets

Linford J B Briant et al. Cell Rep. .

Abstract

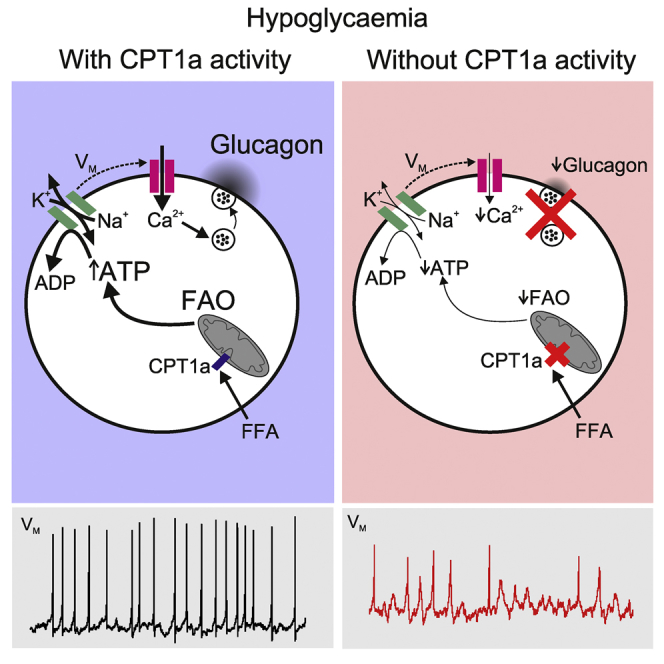
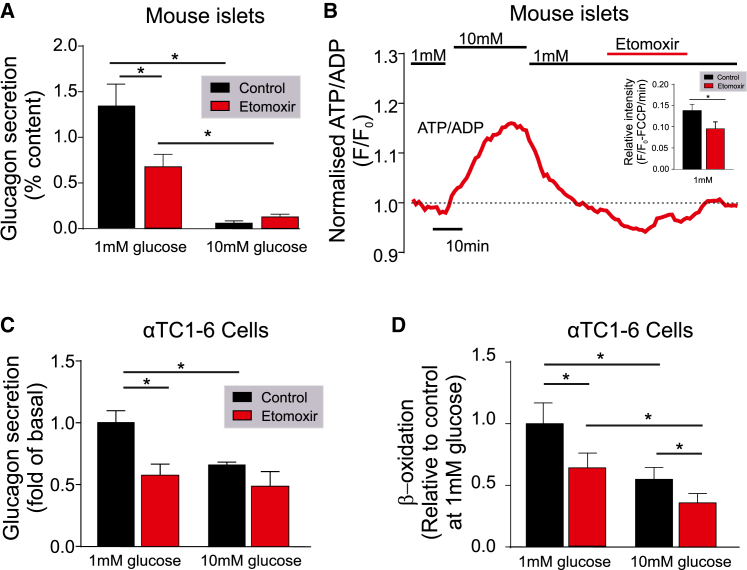
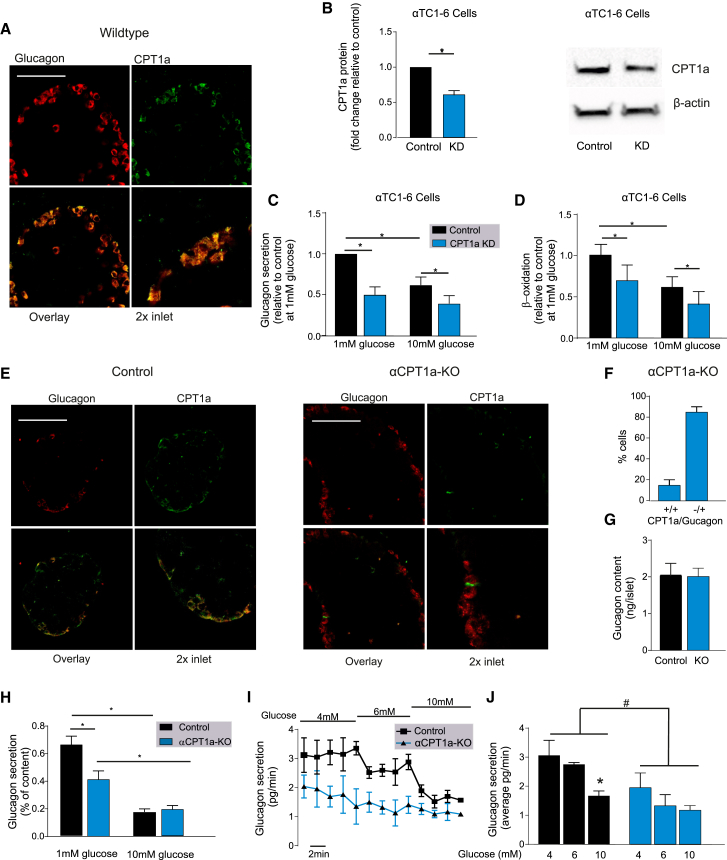
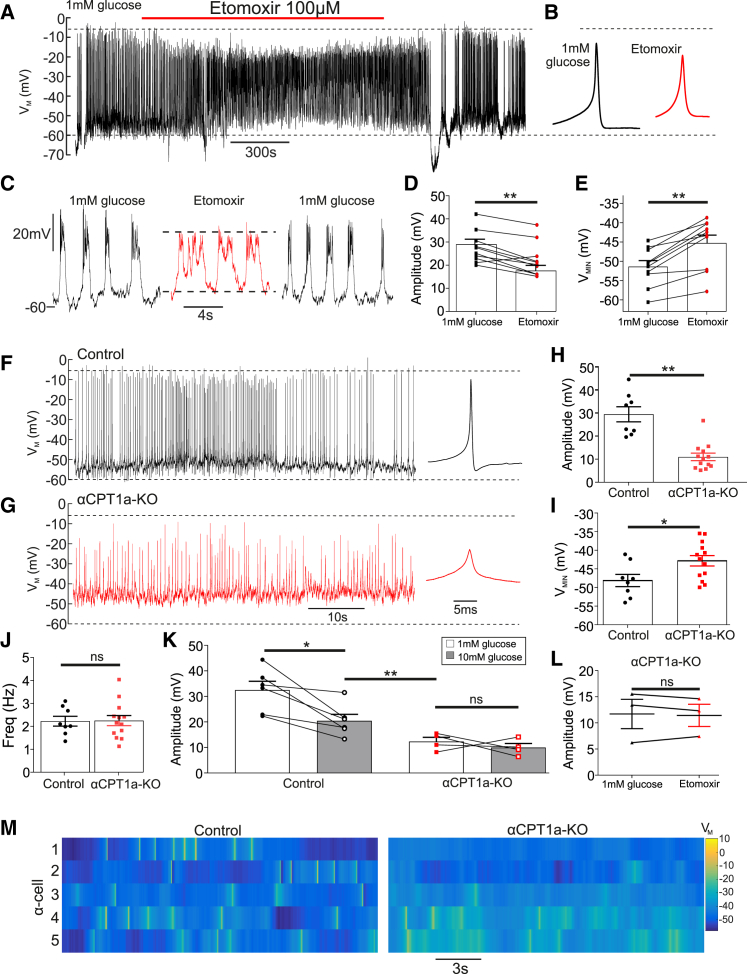
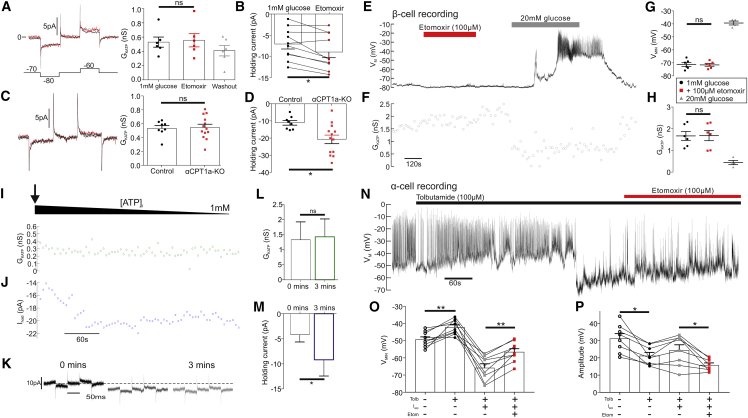
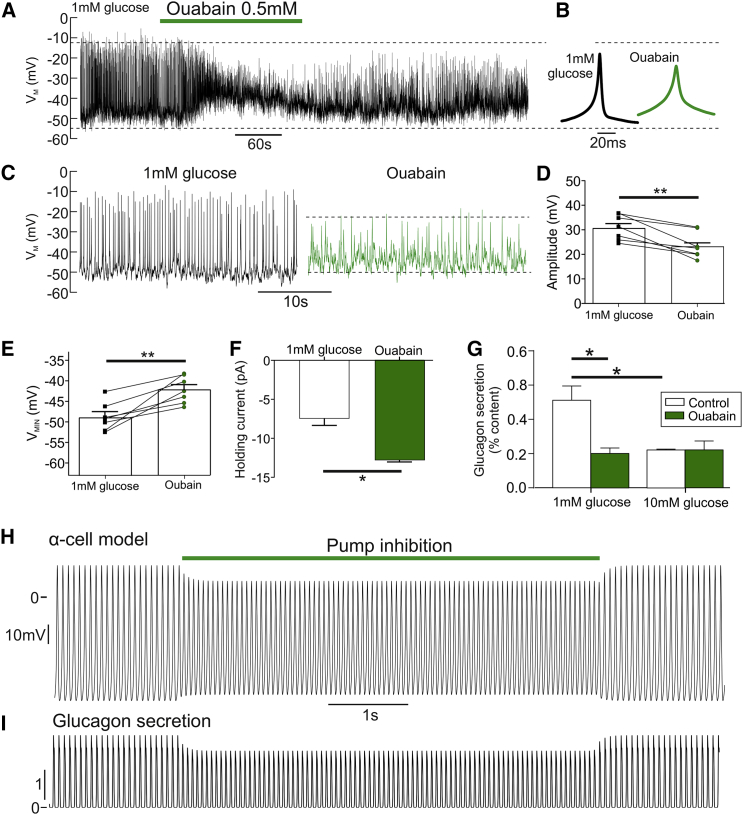
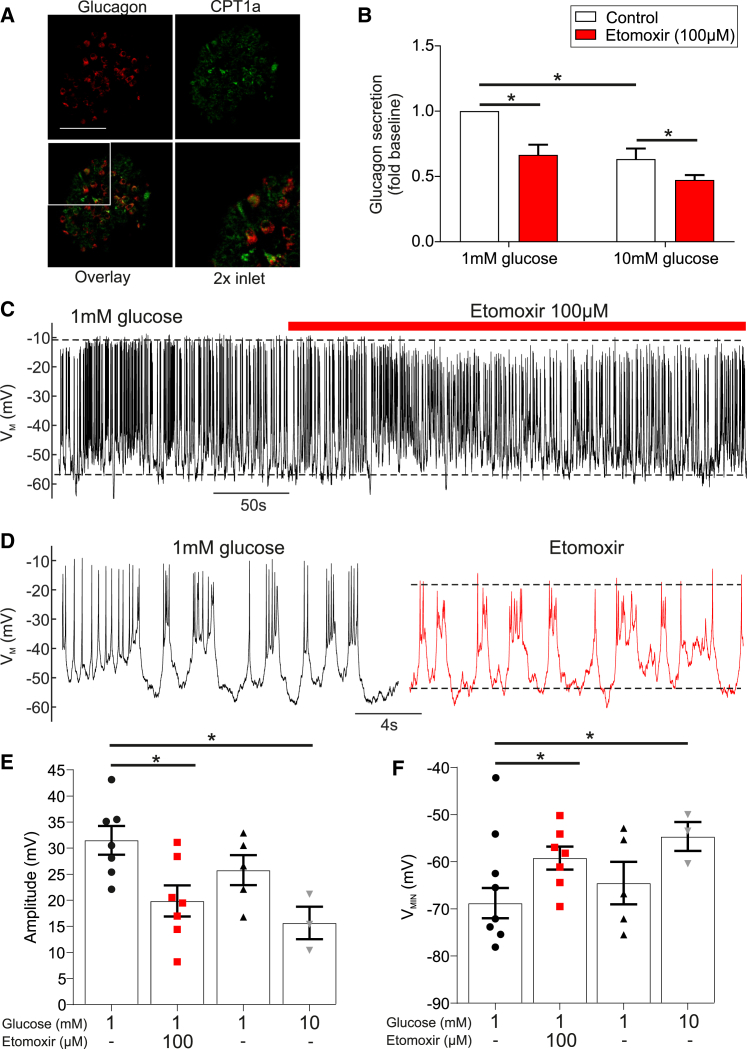
Glucagon, the principal hyperglycemic hormone, is secreted from pancreatic islet α cells as part of the counter-regulatory response to hypoglycemia. Hence, secretory output from α cells is under high demand in conditions of low glucose supply. Many tissues oxidize fat as an alternate energy substrate. Here, we show that glucagon secretion in low glucose conditions is maintained by fatty acid metabolism in both mouse and human islets, and that inhibiting this metabolic pathway profoundly decreases glucagon output by depolarizing α cell membrane potential and decreasing action potential amplitude. We demonstrate, by using experimental and computational approaches, that this is not mediated by the KATP channel, but instead due to reduced operation of the Na+-K+ pump. These data suggest that counter-regulatory secretion of glucagon is driven by fatty acid metabolism, and that the Na+-K+ pump is an important ATP-dependent regulator of α cell function.

Keywords: Ca2+; KATP; fasting; glucose; islet; liver; metabolism.


Figures

None
Graphical abstract
Figure 1
Figure 1
Blocking FFA Transport Pharmacologically or by CPT1a Knockdown Reduces Glucagon Secretion in Mouse α Cells and αTC1-6 Cells (A) Glucagon secretion from WT mouse islets at 1 and 10 mM glucose with or without etomoxir (100 μM) reduced glucagon secretion (n = 3 mice). (B) ATP production in WT mouse islets during exposure to 1 or 10 mM glucose, as well as 1 mM glucose and etomoxir (100 μM) (n = 4 mice). (C) Glucagon secretion from αTC1-6 cells at 1 and 10 mM glucose with or without etomoxir (100 μM) (n = 3). (D) β-Oxidation measured using [3H]palmitate in αTC1-6 cells at 1 and 10 mM glucose with or without etomoxir (100 μM) (n = 6 observations, from 2 experiments). All data are represented as mean ± SEM. Paired t test with Tukey post hoc or two-way ANOVA with Student-Newman-Keuls post hoc; p < 0.05. See also Figure S1.
Figure 2
Figure 2
Knockout of CPT1a Specifically in α Cells Reduces Glucagon Secretion (A) Immunofluorescence for glucagon (red) and CPT1a (green) in WT mouse islets from pancreatic slides. Scale bar, 50 μM. (B) Knockdown (KD) of CPT1a in αTC1-6 cells treated with either scrambled small interfering RNA (siRNA; control) or siRNA targeting Cpt1a mRNA (note the ∼40% reduction) (n = 6 observations from 3 experiments). (C) Glucagon secretion in αTC1-6 cells at 1 and 10 mM glucose treated with either scrambled siRNA (control) or siRNA targeting Cpt1a mRNA (n = 3). (D) β-Oxidation measured using [3H]palmitate in αTC1-6 cells at 1 and 10 mM glucose treated with either scrambled siRNA (control) or siRNA targeting Cpt1a mRNA (n = 6 observations, from 2 experiments). (E) Immunofluorescent detection of glucagon (red) and CPT1a (green) in isolated islets from α cell-specific knockout of Cpt1a (αCPT1a-KO) and littermate control mice. Scale bar, 50 μM (n = 5). (F) Percentage (%) of cells that show co-localization of CPT1a and glucagon in αCPT1a-KO mice (n = 5 islets, 3 mice, 145 cells). (G) Glucagon content in isolated islets from control and αCPT1a-KO (KO) islets (n = 6). (H) Glucagon secretion from isolated islets from control and αCPT1a-KO mice at 1 and 10 mM glucose (n = 6). (I) Glucagon secretion during perfusion in control (n = 3) and αCPT1a-KO (n = 3) mice at 4, 6, and 10 mM glucose. (J) Average glucagon secretion from control (n = 3) and αCPT1a-KO mice (n = 3) at 4, 6, and 10 mM glucose, calculated from the last 8–10 min in each condition. Two-way ANOVA with post hoc: #p < 0.05 versus control; p < 0.05 versus 4 mM glucose. Paired t test with Tukey post hoc or two-way ANOVA; p < 0.05. See also Figure S1.
Figure 3
Figure 3
Cpt1a Knockout Reduces Fasting Plasma Glucose (A) Plasma glucose in fed control and αCPT1a-KO (KO) mice (n = 14 ). (B) Plasma glucagon in fed control and KO mice (n = 4–5). (C) Representative blots of PEPCK, G6PC, and calnexin in fed control and KO mice. (D) Protein content of hepatic PEPCK and G6PC in fed control and KO mice (n = 3–5). (E) Plasma glucose in control and KO mice following a 4-hr fast (n = 10–12). (F) Plasma glucagon in control and KO mice following a 4-hr fast (n = 4–5). (G) Difference between 4 hr fasted and fed plasma glucagon in control and KO mice (n = 4–5). (H) Plasma ketone bodies in control and KO mice following a 4-hr fast (n = 7–9). All data are represented as mean ± SEM. Paired t test with Tukey post hoc; p < 0.05. ns, not significant. See also Figure S1.
Figure 4
Figure 4
Disruption of FFA Transport by CPT1a Reduces Action Potential Amplitude in Mouse α Cells (A) Electrical activity in WT α cell at 1 mM glucose with or without etomoxir (100 μM) (10 islets from 6 mice). (B) Average action potential waveform for (A), in etomoxir compared with 1 mM glucose, measured over the entire experimental condition. (C) Expanded view on 1 mM glucose and etomoxir conditions for (A). (D) Action potential amplitude in WT α cells at 1 mM glucose with or without etomoxir (100 μM) (10 islets from 6 WT mice). (E) Minimum membrane potential (VMIN) in WT α cells at 1 mM glucose with or without etomoxir (100 μM) (10 islets from 6 mice). (F) Electrical activity in control α cell at 1 mM glucose. (G) Electrical activity in αCPT1a-KO α cell at 1 mM glucose. (H) Action potential amplitude in α cells from αCPT1a-KO compared with control at 1 mM glucose (8 control islets for 4 mice and 13 αCPT1a-KO islets for 4 mice). (I) Minimal potential (VMIN) in α cells from αCPT1a-KO mice compared with control at 1 mM glucose (8 control islets for 4 mice and 13 αCPT1a-KO islets for 4 mice). (J) Firing frequency in control and αCPT1a-KO islets at 1 mM glucose (8 control islets for 4 mice) and 13 αCPT1a-KO islets for 4 mice). (K) Action potential amplitude in α cells from control and αCPT1a-KO islets at 1 and 10 mM glucose (6 control islets for 4 mice and 6 αCPT1a-KO islets for 4 mice). (L) Action potential amplitude in α cells from αCPT1a-KO islets at 1 mM glucose with or without etomoxir (100 μM) (3 islets from 3 mice for each genotype). (M) Raster plots demonstrating robust action potentials in 5 control α cells, and weaker action potentials in 5 α cells from αCPT1a-KO islets. Paired t test with Tukey post hoc; p < 0.05; ∗∗p < 0.01; ∗∗∗p < 0.001. See also Figures S1 and S2.
Figure 5
Figure 5
Inhibition of CPT1a Disrupts α Cell Membrane Potential via a KATP-Independent Mechanism (A) GKATP in wild-type (WT) mouse α cells at 1 mM glucose with or without etomoxir (100 μM) (6 islets, 5 mice). (B) Holding current in WT mouse α cells at 1 mM glucose with or without etomoxir (100 μM) (11 islets, 6 mice). (C) GKATP in α cells from αCPT1a-KO mice compared with control at 1 mM glucose (8 control islets from 4 mice and 13 αCPT1a-KO islets from 4 mice). (D) Holding current in α cells from αCPT1a-KO mice compared with control at 1 mM glucose (8 control islets for 4 mice and 13 αCPT1a-KO islets for 4 mice). (E) Electrical activity in WT β cell at 1 mM glucose with or without etomoxir (100 μM) and at 20 mM glucose. (F) GKATP in WT β cell at 1 mM glucose with or without etomoxir (100 μM) and at 20 mM glucose. (G) Grouped data of VM recording in β cells following etomoxir and 20 mM glucose application (6 islets from 6 WT mice). (H) Grouped data of GKATP recording in β cells following etomoxir and 20 mM glucose application (6 islets from 6 WT mice). (I) To mimic the effects of etomoxir in 1 mM glucose on [ATP]i, we artificially reduced [ATP]i by setting the pipette concentration (1 mM) to be lower than the putative [ATP]i in 1 mM glucose (>1 mM; Detimary et al., 1998) and measured GKATP. The arrow denotes when whole cell was achieved, which initiates the run-down of [ATP]i from the endogenous concentration to the pipette concentration. (J) Holding current (Ihold) from (I). (K) GKATP and Ihold after 0, 1, and 3 min of whole-cell recording (I). (L) Grouped data, recording GKATP during artificial run-down of [ATP]i (4 WT islets, 4 mice). (M) Grouped data, recording Ihold during artificial run-down of [ATP]i (4 WT islets, 4 mice). (N) Membrane potential recording from a WT α cell. Tolbutamide was applied to maximally open KATP channels. A negative current was then injected to hyperpolarize the α cell. Etomoxir was still able to depolarize α cells. (O) Grouped data for change in minimum potential (VMIN) (n = 8 islets, n = 4 mice). (P) Grouped data for change in action potential amplitude (n = 8 islets, n = 4 mice). Paired t test with Tukey post hoc or two-way ANOVA; p < 0.05; ∗∗p < 0.01; ∗∗∗p < 0.001. See also Figures S1 and S2.
Figure 6
Figure 6
FFA Oxidation Maintains α Cell Membrane Potential by Energizing the Na+-K+ Pump (A) Electrical activity in a WT α cell in response to 1 mM glucose with or without ouabain (0.5 mM). (B) Average action potential waveform for (A) during 1 mM glucose and ouabain, measured over entire experimental condition. (C) Expanded view on 1 mM glucose and ouabain conditions for (A). (D) Grouped data for change in action potential amplitude in response to 1 mM glucose with or without ouabain (0.5 mM; 7 islets, 4 WT mice). (E) Grouped data for change in minimum membrane potential (VMIN) in WT α cells in response to 1 mM glucose with or without ouabain (0.5 mM; 7 islets, 4 WT mice). (F) The holding current in absolute value in WT α cells, in response to 1 mM glucose with or without ouabain (0.5 mM; 7 islets, 4 WT mice). (G) Glucagon secretion from WT islets at 1 and 10 mM glucose with or without ouabain (0.5 mM; n = 4 mice). (H) Mathematical model of α cell electrical activity demonstrates that a reduction of Na+-K+ pump activity (Ipump) reduces action potential amplitude, mimicking blockade of CPT1a. (I) Accompanying model of glucagon secretion demonstrates that this results in a reduction of glucagon secretion, also mimicking blockade of CPT1a. All data are represented as mean ± SEM. Paired t test with Tukey post hoc or two-way ANOVA with Student-Newman-Keuls post hoc; p < 0.05. See also Figure S1.
Figure 7
Figure 7
CPT1a Blockade in Human Islets Reduces α Cell Membrane Potential and Glucagon Secretion (A) Immunofluorescent detection of glucagon (red) and CPT1a (green) in isolated human islets (scale bar, 50 μm). (B) Glucagon secretion from human islets at 1 and 10 mM glucose with or without etomoxir (100 μM) reduced glucagon secretion (n = 3 donors). (C) Electrical activity in human α cells at 1 mM glucose with or without etomoxir (100 μM) (n = 3 donors, ≤7 cells). (D) Expanded view of 1 mM glucose and etomoxir conditions for (C). (E) Action potential amplitude in human α cells at 1 mM glucose with or without etomoxir (100 μM) and at 10 mM glucose (n = 3 donors, ≤7 cells). (F) Minimum potential in human α cells at 1 mM glucose with or without etomoxir (100 μM) and at 10 mM glucose (n = 3 donors, ≤7 cells). All data are represented as mean ± SEM. Paired t test with Tukey post hoc or two-way ANOVA with Student-Newman-Keuls post hoc; p < 0.05.

Similar articles

Cited by

References

    1. Adam J., Ramracheya R., Chibalina M.V., Ternette N., Hamilton A., Tarasov A.I., Zhang Q., Rebelato E., Rorsman N.J.G., Martín-Del-Río R. Fumarate hydratase deletion in pancreatic β cells leads to progressive diabetes. Cell Rep. 2017;20:3135–3148. - PMC - PubMed
    1. Allister E.M., Robson-Doucette C.A., Prentice K.J., Hardy A.B., Sultan S., Gaisano H.Y., Kong D., Gilon P., Herrera P.L., Lowell B.B., Wheeler M.B. UCP2 regulates the glucagon response to fasting and starvation. Diabetes. 2013;62:1623–1633. - PMC - PubMed
    1. Attwell D., Laughlin S.B. An energy budget for signaling in the grey matter of the brain. J. Cereb. Blood Flow Metab. 2001;21:1133–1145. - PubMed
    1. Barg S., Galvanovskis J., Göpel S.O., Rorsman P., Eliasson L. Tight coupling between electrical activity and exocytosis in mouse glucagon-secreting alpha-cells. Diabetes. 2000;49:1500–1510. - PubMed
    1. Bélanger M., Allaman I., Magistretti P.J. Brain energy metabolism: focus on astrocyte-neuron metabolic cooperation. Cell Metab. 2011;14:724–738. - PubMed

Publication types

MeSH terms

LinkOut - more resources