. 2018 Jun 12;23(11):3392-3406.
doi: 10.1016/j.celrep.2018.05.039.

Integrated Molecular Characterization of Testicular Germ Cell Tumors

Collaborators, Affiliations

Integrated Molecular Characterization of Testicular Germ Cell Tumors

Hui Shen et al. Cell Rep. .

Abstract

We studied 137 primary testicular germ cell tumors (TGCTs) using high-dimensional assays of genomic, epigenomic, transcriptomic, and proteomic features. These tumors exhibited high aneuploidy and a paucity of somatic mutations. Somatic mutation of only three genes achieved significance-KIT, KRAS, and NRAS-exclusively in samples with seminoma components. Integrated analyses identified distinct molecular patterns that characterized the major recognized histologic subtypes of TGCT: seminoma, embryonal carcinoma, yolk sac tumor, and teratoma. Striking differences in global DNA methylation and microRNA expression between histology subtypes highlight a likely role of epigenomic processes in determining histologic fates in TGCTs. We also identified a subset of pure seminomas defined by KIT mutations, increased immune infiltration, globally demethylated DNA, and decreased KRAS copy number. We report potential biomarkers for risk stratification, such as miRNA specifically expressed in teratoma, and others with molecular diagnostic potential, such as CpH (CpA/CpC/CpT) methylation identifying embryonal carcinomas.

Keywords: DNA methylation; KIT; The Cancer Genome Atlas; copy number; exome sequencing; miR-375; nonseminoma; seminoma; testicular germ cell tumors.


Conflict of interest statement

DECLARATION OF INTERESTS

A.C. and M.M. receive research funding from Bayer AG. J.M.S. is a founder and part owner of Five3 Genomics LLC and a member of its scientific advisory board, which owns the license to PARADIGM software.

Figures
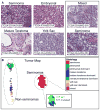
Figure 1
Figure 1. Histologic and Molecular Classification of TGCTs
(A) Representative images of H&E-stained slides of frozen sections are shown for seminomas, EC, mature teratomas, and yolk sac tumors. Box at right shows two asynchronous primaries from the same patient. All images 100× magnification. (B) Tumor Map visual representation of molecular heterogeneity separating seminomas and NSGCTs. Samples are displayed as hexagons, and the spatial layout reflects sample groupings and molecular relations between samples. Samples are colored based on their histological classification. In the seminoma inset, samples are colored by KIT mutation status. KIT wild-type, green; KIT mutant, blue. See also Figures S1 and S5 and Tables S4, S5, S6, and S7.
Figure 2
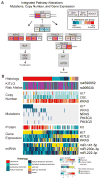
Figure 2. Molecular Alterations and Features across 137 TGCT Samples
(A) Somatic mutation frequency (mutations/Mb) from exome sequencing. The horizontal gray dashed line marks the median mutation rate of 0.5 mutations/Mb. The vertical gray line divides pure seminomas from NSGCTs. (B) Tumor and patient features per sample. Whole genome doubling (WGD) and i(12p) status are using the ABSOLUTE algorithm. Calls for WGD or inferred i(12p) status could not be made for six low-purity samples. Cryptorchidism status, family history of testicular germ cell tumor (TGCT) or other cancer, and presence of double primaries are displayed. Unk, unknown. (C) Significant recurrent mutations (KIT, KRAS, and NRAS) or curated based on frequency or biological relevance. (D) Three known oncogenes were significantly focally amplified. Values represent the number of gene copies detected using the ABSOLUTE integer copy number. See also Figures S2 and S3 and Table S3.
Figure 3
Figure 3. Inferred Order of Somatic Mutations and DNA Copy Number Alterations in TGCTs
Four seminomas with co-existing somatic mutations in KIT, KRAS, and NRAS were selected. The timing of somatic events within each sample was inferred by integrated analysis of mutation multiplicity, allelic integer copy number, and whole-genome doubling status. Mutation multiplicity (sq) was calculated from purity, total copy number (CN), and tumor variant allele fraction (TVAF) as follows: sq = TVAF[(CN*purity)+(2*(1–purity))]/purity. Integer copy number, whole-genome doubling status, and purity of tumor genomes were calculated using the ABSOLUTE algorithm. Cryptorchidism (crypt), isochromosome 12p [i(12p)]. Gray and black identify homologous chromosomes.
Figure 4
Figure 4. Dramatic DNA Methylation Differences Observed between TGCT Histology Types
(A) Smoothed density plots show overall distributions of beta values at CpG (left) and CpH sites (right) grouped by seminoma, EC and EC dominant, and other (OTHER) tumors. Vertical dashed lines indicate locations corresponding to unmethylated (U) and methylated (M) sites. Four primordial germ cell (PGC) samples from external whole-genome bisulfite sequencing (WGBS) studies are plotted for the same sites included on the HM450 arrays. (B) Overall correlation between the DNA methylation signature-based lymphocyte estimates (x axis) versus mutation and SNP array-based (ABSOLUTE) tumor purity estimates (y axis) for 131 tumors. Six additional tumors without ABSOLUTE estimates as a result of extremely low purity are plotted with hollow circles. (C) DNA methylation at 2,083 (0.5%) loci (rows) with residual methylation in seminomas (columns) differs based on KIT/RAS mutation status. Data are corrected for lymphocyte infiltration (uncorrected data shown in Figure S1D). Blue to red indicates 0% to 100% methylation. Top color bars annotate the histology of each tumor and mutation status in KIT/KRAS/NRAS (black, mutants; gray, wild-type). (D) DNA methylation patterns at 57 imprinted loci. Inferred lymphocyte fraction is included as the second column color bar (blue to red: low to high level of contamination). External reference data (right) are plotted for the same set of loci representing paternal (Pat; 1, sperm; 2, hydatidiform mole; 3, paternal Unipaternal Disomy [pUPD] leukocyte), maternal (Mat; 4, maternal Unipaternal Disomy [mUPD] leukocyte; 5, parthenogenetically derived oocytes), and placental (Pl; 6, placenta)-imprinting patterns, in addition to ESCs (7, ESCs from 2, oocyte) and somatic tissues (8, somatic tissues). (E) The GNAS complex locus demonstrates contrasting DNA methylation patterns in different subtypes. Seminomas show an overall lack of methylation (observed methylation explainable by lymphocytic infiltration); EC and EC-dominant tumors show extensive methylation at the paternal DMR at the NESP55 promoter, and other tumors tend to have methylation at the maternal DMR near the XLαs promoter. (F) RNA-seq reads for different GNAS transcripts are consistent with DNA methylation patterns. Eleven tumors with relatively high purity of different histologies are shown. See also Figure S4.
Figure 5
Figure 5. Immune Signatures Are High in Seminomas
(A) Gene expression data (log2 median-centered RNA-seq by expectation maximization [RSEM] values) are displayed for 78 published gene expression signatures and ordered by immune category (left vertical bar). Tumors are ordered by histology and clustered by gene expression. Annotation tracks for DNA methylation lymphocyte infiltration score and mutation status are displayed. (B–D) Boxplots of immune features comparing seminoma KIT mutant, seminoma KIT WT, and NSGCTs. (B) Median expression of immune signatures, (C) DNA methylation lymphocytic infiltration scores, and (D) median cancer-testis-specific antigen gene expression. Boxplots display the median value, upper and lower quartiles, and the whiskers represent the interquartile range. Each dot represents the value of a single sample. See also Figure S6.
Figure 6
Figure 6. Analysis of KIT and KIT Ligand in TGCTs
(A) Integrated analysis of the Kit pathway indicating the frequency of multiple genomic alterations within the Kit pathway. (B) A multiple platform characterization of KIT and KIT ligand across testicular germ cell tumors. Samples are first ordered by tumor histology. Within histology, tumors are ordered by KIT mutation status and then by KIT mRNA expression from high to low. Missing values are depicted as blank or white space within each heatmap. See also Figure S7.
Figure 7
Figure 7. Genomic Alterations and Features in Four Patients with Asynchronous Double Primaries
(A) Venn diagrams showing no overlap between somatic mutations identified in the first and second primary tumors, with number of significantly mutated genes shown. 01, first primary; 05, second primary; R, right; L, left. (B) SCNAs across the genome relative to the tumor ploidy (also shown). Red, amplification; blue, deletion. (C) For each platform, the first primary tumor is on the x axis and the second primary tumor is on the y axis. From left to right: beta values as a measure of DNA methylation across probes, with color representing the smoothed density of the probes; the reads per million (RPM) abundance of 303 miRNAs used in unsupervised clustering analysis on a log scale; log2 mRNA expression (RSEM) of 2,878 variably and highly expressed genes used for unsupervised clustering; RPPA expression values for 218 antibodies assayed. RPPA was not assessed for at least one primary tumor for patients TCGA-2G-AAGI and TCGA-2G-AAHP.

References

    1. Albany C, Hever-Jardine MP, von Herrmann KM, Yim CY, Tam J, Warzecha JM, Shin L, Bock SE, Curran BS, Chaudhry AS, et al. Refractory testicular germ cell tumors are highly sensitive to the second generation DNA methylation inhibitor guadecitabine. Oncotarget. 2017;8:2949–2959. - PMC - PubMed
    1. Alexandrov LB, Nik-Zainal S, Wedge DC, Aparicio SA, Behjati S, Biankin AV, Bignell GR, Bolli N, Borg A, Børresen-Dale AL, et al. Australian Pancreatic Cancer Genome Initiative; ICGC Breast Cancer Consortium; ICGC MMML-Seq Consortium; ICGC PedBrain. Signatures of mutational processes in human cancer. Nature. 2013;500:415–421. - PMC - PubMed
    1. Almeida LG, Sakabe NJ, deOliveira AR, Silva MC, Mundstein AS, Cohen T, Chen YT, Chua R, Gurung S, Gnjatic S, et al. CTdatabase: a knowledge-base of high-throughput and curated data on cancer-testis antigens. Nucleic Acids Res. 2009;37:D816–D819. - PMC - PubMed
    1. Banks K, Tuazon E, Berhane K, Koh CJ, De Filippo RE, Chang A, Kim SS, Daneshmand S, Davis-Dao C, Lewinger JP, et al. Cryptorchidism and testicular germ cell tumors: comprehensive meta-analysis reveals that association between these conditions diminished over time and is modified by clinical characteristics. Front Endocrinol (Lausanne) 2013;3:182. - PMC - PubMed
    1. Brabrand S, Johannessen B, Axcrona U, Kraggerud SM, Berg KG, Bakken AC, Bruun J, Fosså SD, Lothe RA, Lehne G, Skotheim RI. Exome sequencing of bilateral testicular germ cell tumors suggests independent development lineages. Neoplasia. 2015;17:167–174. - PMC - PubMed

Publication types

MeSH terms

Supplementary concepts