

Principled multi-omic analysis reveals gene regulatory mechanisms of phenotype variation
- PMID: 29898900
- PMCID: PMC6071639
- DOI: 10.1101/gr.227066.117
Principled multi-omic analysis reveals gene regulatory mechanisms of phenotype variation
Abstract
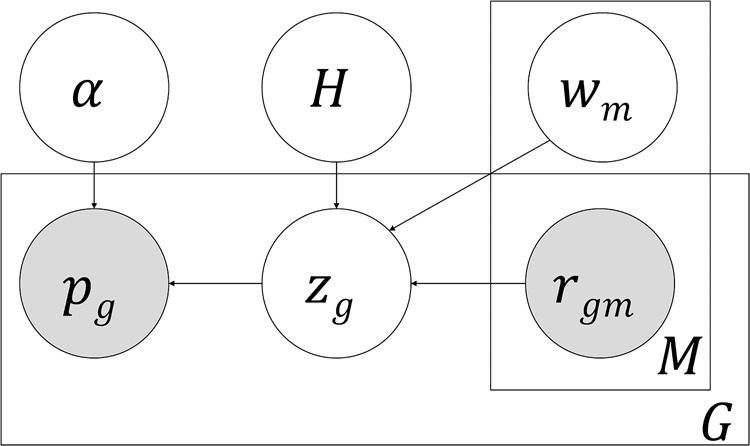
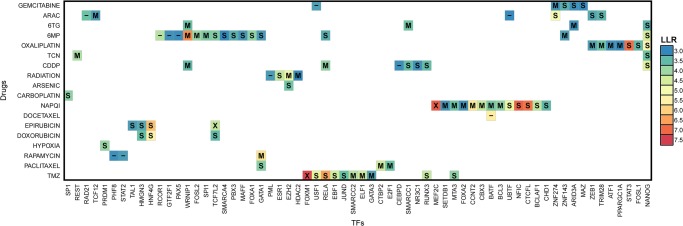
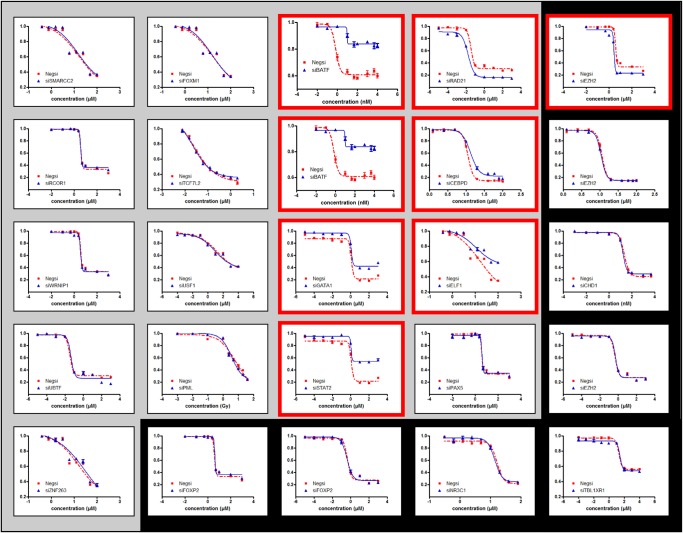
Recent studies have analyzed large-scale data sets of gene expression to identify genes associated with interindividual variation in phenotypes ranging from cancer subtypes to drug sensitivity, promising new avenues of research in personalized medicine. However, gene expression data alone is limited in its ability to reveal cis-regulatory mechanisms underlying phenotypic differences. In this study, we develop a new probabilistic model, called pGENMi, that integrates multi-omic data to investigate the transcriptional regulatory mechanisms underlying interindividual variation of a specific phenotype-that of cell line response to cytotoxic treatment. In particular, pGENMi simultaneously analyzes genotype, DNA methylation, gene expression, and transcription factor (TF)-DNA binding data, along with phenotypic measurements, to identify TFs regulating the phenotype. It does so by combining statistical information about expression quantitative trait loci (eQTLs) and expression-correlated methylation marks (eQTMs) located within TF binding sites, as well as observed correlations between gene expression and phenotype variation. Application of pGENMi to data from a panel of lymphoblastoid cell lines treated with 24 drugs, in conjunction with ENCODE TF ChIP data, yielded a number of known as well as novel (TF, Drug) associations. Experimental validations by TF knockdown confirmed 41% of the predicted and tested associations, compared to a 12% confirmation rate of tested nonassociations (controls). An extensive literature survey also corroborated 62% of the predicted associations above a stringent threshold. Moreover, associations predicted only when combining eQTL and eQTM data showed higher precision compared to an eQTL-only or eQTM-only analysis using pGENMi, further demonstrating the value of multi-omic integrative analysis.
© 2018 Hanson et al.; Published by Cold Spring Harbor Laboratory Press.
Figures
Similar articles
-
Mechanistic interpretation of non-coding variants for discovering transcriptional regulators of drug response.BMC Biol. 2019 Jul 30;17(1):62. doi: 10.1186/s12915-019-0679-8. BMC Biol. 2019. PMID: 31362726 Free PMC article.
-
Single Nucleotide Polymorphisms at a Distance from Aryl Hydrocarbon Receptor (AHR) Binding Sites Influence AHR Ligand-Dependent Gene Expression.Drug Metab Dispos. 2019 Sep;47(9):983-994. doi: 10.1124/dmd.119.087312. Epub 2019 Jul 10. Drug Metab Dispos. 2019. PMID: 31292129 Free PMC article.
-
Integrative Multi-omic Analysis of Human Platelet eQTLs Reveals Alternative Start Site in Mitofusin 2.Am J Hum Genet. 2016 May 5;98(5):883-897. doi: 10.1016/j.ajhg.2016.03.007. Epub 2016 Apr 28. Am J Hum Genet. 2016. PMID: 27132591 Free PMC article.
-
The study of eQTL variations by RNA-seq: from SNPs to phenotypes.Trends Genet. 2011 Feb;27(2):72-9. doi: 10.1016/j.tig.2010.10.006. Epub 2010 Nov 29. Trends Genet. 2011. PMID: 21122937 Review.
-
Cloudy with a Chance of Insights: Context Dependent Gene Regulation and Implications for Evolutionary Studies.Genes (Basel). 2019 Jun 28;10(7):492. doi: 10.3390/genes10070492. Genes (Basel). 2019. PMID: 31261769 Free PMC article. Review.
Cited by
-
De Novo Assembly of the Nearly Complete Fathead Minnow Reference Genome Reveals a Repetitive but Compact Genome.Environ Toxicol Chem. 2022 Feb;41(2):448-461. doi: 10.1002/etc.5266. Epub 2022 Jan 18. Environ Toxicol Chem. 2022. PMID: 34888930 Free PMC article.
-
Whole-genome CpG-resolution DNA Methylation Profiling of HNSCC Reveals Distinct Mechanisms of Carcinogenesis for Fine-scale HPV+ Cancer Subtypes.Cancer Res Commun. 2023 Aug 30;3(8):1701-1715. doi: 10.1158/2767-9764.CRC-23-0009. eCollection 2023 Aug. Cancer Res Commun. 2023. PMID: 37654626 Free PMC article.
-
Torch-eCpG: a fast and scalable eQTM mapper for thousands of molecular phenotypes with graphical processing units.BMC Bioinformatics. 2024 Feb 14;25(1):71. doi: 10.1186/s12859-024-05670-4. BMC Bioinformatics. 2024. PMID: 38355413 Free PMC article.
-
An integrated multi-omics approach to identify regulatory mechanisms in cancer metastatic processes.Genome Biol. 2021 Jan 7;22(1):19. doi: 10.1186/s13059-020-02213-x. Genome Biol. 2021. PMID: 33413550 Free PMC article.
-
Mechanistic interpretation of non-coding variants for discovering transcriptional regulators of drug response.BMC Biol. 2019 Jul 30;17(1):62. doi: 10.1186/s12915-019-0679-8. BMC Biol. 2019. PMID: 31362726 Free PMC article.
References
-
- Bavelloni A, Faenza I, Aluigi M, Ferri A, Toker A, Maraldi NM, Marmiroli S. 2000. Inhibition of phosphoinositide 3-kinase impairs pre-commitment cell cycle traverse and prevents differentiation in erythroleukaemia cells. Cell Death Differ 7: 112–117. - PubMed
Publication types
MeSH terms
Substances
Grants and funding
LinkOut - more resources
Full Text Sources
Other Literature Sources
Miscellaneous